Turning Off the Fire Hose with Synthesis
Editor's note: Automated speech-to-text transcription, edited lightly for clarity.
 Gregg Poryzees, Vanguard, gave this presentation originally at The Quirk’s Event - Los Angeles. He then re-recorded the presentation for the Wisdom Wednesday on April 12, 2023.
Gregg presented on the importance and the art of synthesis when presenting data to stakeholders. He states that this way of presenting makes the data easier for a stakeholder to take in and makes it easier for change to be implemented as a result.
Watch the webinar recording or read through the transcript below.
Webinar transcription:
Joe Rydholm:
Hi everybody! I’m Quirk’s Editor Joe Rydhom. Welcome to our webinar “Turning Off the Fire Hose: The Importance and Art of Synthesis in a Data-Driven Organization.” Which is a rerecording of a session originally delivered at our Los Angeles Quirk’s Event in February. And if you are a client-side researcher and you would like more information about speaking at an upcoming Quirk’s Event, please reach out to me at joe@quirks.com and my contact information will also be available in the chat tab during the session.
Speaking of the chat tab, that's where you can interact with other attendees and you can use the Q&A tab to post questions and we will get to as many as we have time for at the end. Enjoy the webinar!
Gregg Poryzees:
Hey everyone, my name is Gregg Poryzees and I am the head of Personal Investor Market Research at Vanguard. And thank you for inviting me to speak at Quirk's Wisdom Wednesdays. You know what a great name for a learning forum. I love it.
Anyway, today we're going to speak about how to synthesize data to make you and your companies insights rock stars and we are really passionate about synthesis at Vanguard. And the reason is so the research that we deliver matters that we as researchers and as a research department sought after by our stakeholders.
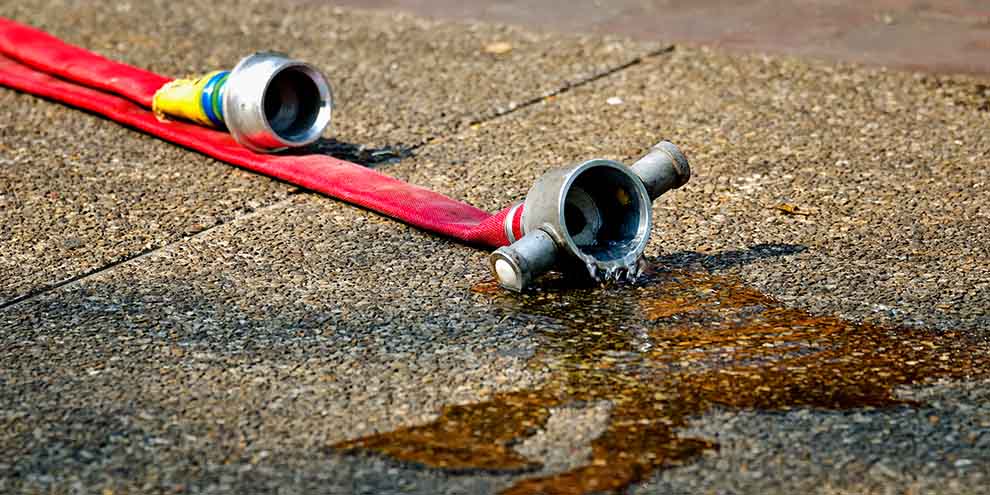
And I'll tell you something about Vanguard that I know that we have in common with a lot of your firms. And that is that there is a lot of data out there, a lot of primary data, a lot of syndicated data, a lot of data that our leaders want, our leaders need. Our leaders love but not delivered like this.
Does this image look familiar? Like drinking water from a fire hose? That is what research can feel like to stakeholders. Reports being tossed over the fence all the time.
You know, it wasn't that long ago that it was bragging rights to say that you worked on and delivered a hundred page report and you say, ‘I'm exhausted. I worked on a hundred page report and just delivered it.’ You know that someone would say, ‘well I worked on a 150 page report and that's without the appendix.’
Well that's not a bragging right anymore. You don't want to be that researcher holding that fire hose and that stakeholder doesn't look too happy either. And one of the reasons that 100 page reports don't pass muster anymore, I think it's nicely summarized in this finding from a global study that was conducted by business intelligence.com and that is that only half of the available information in organizations is actually used for decision making.
Only half that is half of our work doesn't see the light of day. That's such a waste of time and money. But there's good news, there are five ways cited to reverse this trend. And two of those ways have to do with synthesis, improve the way in which information is presented and make information easier to find, again, improve the ways in which it's presented and make the information easier to find.
Also, this is a saying that I found by Dax Bamania who is a productivity guru and the author of the best-selling book, “Productivity Promoter.” And he says this rather understated thing about synthesis, synthesis is actually the most important thing in life, the most important thing in life. So why do you think Dax would say that?
Well, my guess is because synthesis brings clarity and understanding to our lives. You know, our brains are actually meant to process the information around us and bring clarity and understanding to us. And that's what the synthesis does. It brings us information that makes it easier, easier for us to assimilate and to act upon. And when you do that, when you do that repeatedly, it leads to success and that's why it's so important.
Well, so we'll be discussing how to synthesize in just a few minutes, but one thing I want to make sure that I make clear to all of you is that synthesis is not just something you deliver, it's also a mindset. And it's a mindset that manifests itself in three ways. Patience, perspective and habit.
First up, patience. Quell your need for speed. You know, one thing you have to keep in mind is that you need to slow yourself down so that you can speed up the lives of your stakeholders. It's about taking one for the team, being a hero because synthesis takes time, especially if you're going to do it right, it's not something you wanna speed through. To move on to that high visibility project, I will promise you that your synthesis is a high visibility project. It absolutely is a high visibility project and probably will get a lot more play than a single report would also cherish the emerging picture.
What does that mean, cherish the emerging picture. Well that means that whether you'd like it or not, you'll become a subject matter expert or a better subject matter expert than you were before you started that synthesis. You can't help it when you compare contrast and assimilate information, something sticks up here, you become smarter. You'll have that information on the tip of your tongue when you're in important meetings and you'll be sharing that with people who matter and you'll have to make important decisions with that information.
And thirdly, don't derail. In other words, don't procrastinate because synthesis can be very, very simple to do and there's no reason to actually make it worse than you might think it is.
Also, let's talk about perspective. In other words, get into your stakeholder's heads. Always listen, what does that mean? Always listen. And sometimes you're don't know what to synthesize. Someone will say, well, what should I synthesize? Well, one of the best resources for that is listening in meetings. What are questions being asked? What are people actually wondering about and maybe complaining that they have too much information on? That would be a signal for a synthesis.
Also, listen to cues When you deliver reports. If someone says ‘this is a lot of information, I'll get back to you in a couple of weeks.’ They needed more of a synthesis than an actual single report.
Also, have something for everyone in the room. Treat your synthesis when you're presenting like it's the holidays; everyone in that room should have a slide or two. Not only engages the audience, it also elevates the insights that you're delivering outta that report.
And also ask for feedback. I would say ask for honest feedback. And one of the best ways to ask that is like, if I had to do this synthesis over again, what would you say I should do differently? Don't say what, if anything, I should do differently. Say, what should I do differently? Because I will tell you that just because you did one sentence really well doesn't mean the next one will be easier or better. Everyone is different and you'll actually grow as a researcher and someone who synthesizes data by getting that honest feedback and learning as you progress.
And next up we're gonna talk about habits. Deliver little gifts of synthesis. You know, when you actually are sending a report to somebody in the body of the email list the top findings of the report. ‘Hey Mary, here's a report on estate planning. I know you're interested in this. Here are the top findings. Pay special attention to page number five, which is about estate planning and blended families that know that's an area of interest.”
I'll promise you that your email will be read. You'll be appreciated cause you took the time to do that. What did it take? 10 to 15 minutes. I'll say every minute is well spent. Cause chances are that yes, your email will be read and sometimes that report you attached might not also triangulate findings from other sources. In all research reports, in every research report, my team always triangulates findings.
Compare contrast. Don't be shy about calling out a contradictory finding. Might explain why they contradicted how to resolve it. Those are actually the most interesting findings or those that are actually contradictory.
But always triangulate key findings with other researchers because it does two things. It signals to the stakeholder that you did your homework and that they can relax cause they can trust you to have actually researched all the things that matter about that topic. And also expands the insights from that research because it moves beyond just the findings from that study. And also when you receive a request to conduct new, always make sure that you know what's been done before. Because oftentimes you don't need to do that extra study and you've saved your company a lot of time and money. That itself is also a synthesis. It's a small way of doing synthesis. So again, get into the habit.
So now you've been asked to synthesize, what does that look like? Let's go through the process.
First, find your north star. What are the business goals that you're trying to address? And then you go and find the research that addresses those things that you're trying to find out about. And always ask around because chances are that there is research that has been conducted or is being conducted that is not on your radar.
Research, especially in large organizations, is often done in pockets here and there. And I will guarantee that you will not always know all the research is being done on your topic unless you ask around.
And here's what you do. You're gonna start a very simple spreadsheet, very simple, and we'll go through what that looks like in a few minutes. But what you're gonna do is cut and paste, copy and paste a finding that you find important from each report into that spreadsheet.
One, finding per row. Copy and paste. Copy and paste liberally. Don't overthink it. This part goes quickly. Whatever you think looks important, copy and paste it into your spreadsheet.
Then you're gonna go a step back. You'll take a look at all those important findings and you're gonna highlight the ones that you think are the most important. So you might have copy and pasted 20 findings from that report into your spreadsheet. And you're gonna go through and say, ‘you know what? I think these eight are the most important.’ You're gonna highlight those in yellow.
And then you're going to start a big messy PowerPoint deck. And this really helps for people like me who are visually oriented. And that is you are going to go back to the reports that had that yellow highlighted insight in them and take that slide and start creating a PowerPoint deck of all those most important findings from the different reports.
The formats will not look the same but different sizes, colors etc. Don't worry about it looking pretty. Just get it all in there.
And then step four, you're going to organize.
And then step five, you're going to step back and take a look at what themes are emerging. You might shuffle a few slides around here and there. You might drop a few, you might think to add an extra one or two, but you're going to start to see themes emerge. And that is where the magic happens. Then you go and flush out a few themes, summarize, add some data and your synthesis is done.
This is what a synthesis would look like.
As I explained, there are two types of synthesis that we're gonna cover today. This is type one, this is an overall topic. At the bottom are the reports. One report per tab. The first column is the page number in that report where you've found the finding.
And the second column is the findings. The ones that are not highlighted or the ones that were just important. The ones that are yellow are the ones on the second pass that you highlighted as most important. And then any comments you wanna add are in the third column. Again, very simple by the way.
That page number is extremely important. Don't forget that because you have to go back to that report to grab that slide into your big messy PowerPoint deck.
So this is type one, overall topic also because there are tabs at the bottom of the report, your Excel spreadsheet can be shared with others. Everybody can take a report to actually do one of these spreadsheets on, so it's very easily shared with others. So please don't be shy about delegating.
This is what this looks like. When you're all done, themes in the story of say advice. These are the six themes. This is something you would put in the beginning of the report and this is what you actually were able to develop from that overall topic synthesis. Okay? So again, this is what you're looking for. And then you're gonna go through with the report and you're gonna flesh out each of these themes for the audience.
Here's synthesis type two. This is for a larger question that has sub-questions underneath it. This is actually done on a topic called What is Vanguard's value proposition. Well, vanguard's value proposition comes down to a lot of different things from bringing investors to our doors, what are their needs, what are their pain points, etc. In this case, the actual tabs at the bottom are the individual sub-question.
And the rest is the same as synthesis type one page number, finding any comments. Again, this can be shared with others. Feel free to delegate because you have different sub-questions underneath. Every person can take a different question and address as part of the overall synthesis.
So again, a very easy way to set this up, relatively similar to synthesis type one, but again for a larger type of question. And here's what that result would look like. This was like, why do investors come to Vanguard? You would have one of these slides for each of the sub-questions. A nice mix of headlines and data. Again, this is how your synthesis takes shape.
And I know storytelling is something that is near and dear to everybody's heart. And that we as researchers and as a research industry, are trying to get better at it every year. This is a slide from a great article called “How to Structure Your Presentation to Keep Your Audience Wanting More” by Alana Verarde and Orlana Verarde. Just type in how to structure your presentation or seven ways to structure your presentation. And you'll find this very easily online.
And this is my favorite approach called “Hook, Meat and Payoff.”
It starts off with a hook to grab the audience's attention. It could be a provocative statement, a rhetorical question, but it's actually a synthesis of your synthesis. It actually sets the stage, gets your audience to sit up and listen.
Then you have the meat. You lay out your story in nice digestible chunks to actually make sure that your audience is able to grasp the information. Of course, keep it succinct.
And then the payoff. What is the call to action, implications, recommendations, etc. What can I do now that I wasn't able to do before, new to do before, without knowing this information?
Hook, meet, and payoff. There are other approaches as well in the article. I really recommend that you find this and take a good read and spread it around your organizations.
So let's summarize. Synthesis is critical and it requires or required an investment of your time, but the end result is these benefits.
It makes research more valuable. That research will be used, it makes you appreciate it more. In fact, if you do a really good synthesis, you'll be more than appreciated. You'll be loved, but also makes you a better subject matter expert.
As I said before, you cannot help it. When you synthesize lots of information, you'll absorb all that as well and you'll have that information at your fingertips or at the top of your head as well. It helps you and your company succeed as well. And again, don't forget the storytelling.
Thanks very much.