Unprepared for the future?
Editor's note: Tim Macer is managing director, and Sheila Wilson is an associate, at meaning ltd., the U.K.-based research software consultancy which carried out the study on which this article is based.
Technology has never been more important to market research than it is today. Our annual survey of software and technology at research companies around the world has revealed an ever-broadening choice of research methods and technologies in everyday use, facilitating research and delivering the results. Yet our survey has also uncovered some disturbing lack of preparation among research companies for the sweeping changes that technology is making to the world, particularly in the areas of data visualization, text analysis and the growing phenomenon of respondents taking online surveys on smartphones.
This annual survey is carried out by meaning ltd and includes the views of technology decision-makers and influencers at 230 research companies in 36 countries. Sample is selected in proportion to the amount of research carried out in each country, according to ESOMAR’s Global Market Research Report. Results are presented unweighted and we advise that you consider all figures reported to be indicative in nature and not use them as a basis for projections.
Here, we present some of the highlights of the 2011 study. You may also download the full report at meaning.uk.com/mrss.
Research modes offered
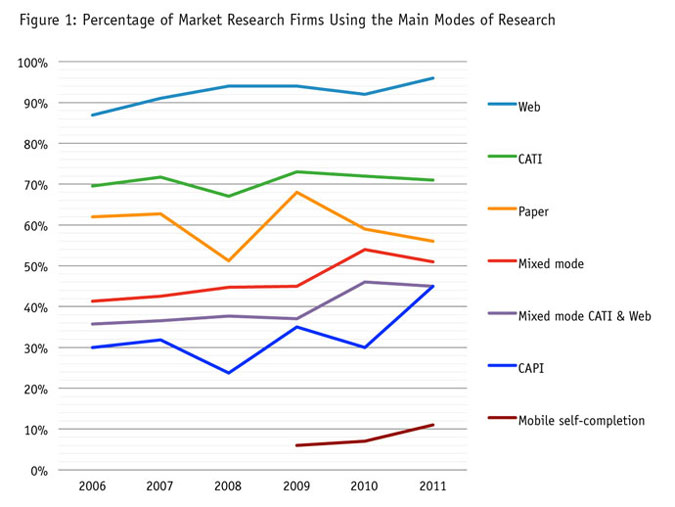
Each year we ask about the proportion of market research companies offering each of the principal modes of research. Mobile self-completion was introduced as a mode in 2009.
When online research reached passed the 90-percent level of penetration in 2007 it looked as if it this mode was close to saturation point. Since then, it has reached 96 percent. We also asked for volumes of research conducted by each mode (not shown) and by our estimates, half the world’s research is now done online.

Asked about where the trends will go next, companies are still optimistic that Web research will continue to grow fairly strongly. The only other mode tabbed for strong growth is mobile self-completion. CATI and paper are predicted to decline and most other modes to remain level or grow modestly. While CATI and paper have both been slated for a decline for several years now, it is only paper that has shown any decline over the years; CATI volumes have remained static, making it rather more resilient than research firms have been anticipating.
Once again the survey has failed to show that mobile research has gained any real traction yet among research clients. By 2011, this was offered by 11 percent of companies, but the volume of work passing through this mode was under 0.5 percent of total quant revenues.
Software upgrades
Every year, we ask if companies have plans to change their software over the next one to two years and if so, what they intend to replace. Each year, we report a surprisingly high proportion of companies that are looking to change their software. In 2011 this measure surpassed all previous estimates and reached an astonishing 46 percent of companies intending to bring in something new. Some interesting differences emerge when broken down by company size: 55 percent of large companies will be looking for new software, as will 50 percent of medium-sized companies but only 40 percent of smaller companies.
Figure 2 shows what software is slated for replacement, based only on those stating they intend to replace some of their software. Small and medium-sized companies are far more likely to have plans to change their panel management software than large companies. In previous years, we have reported that large companies have dominated the move to proprietary panels, often using their own custom-developed software. We suspect we are seeing the smaller firms now seeking to expand into this area too.
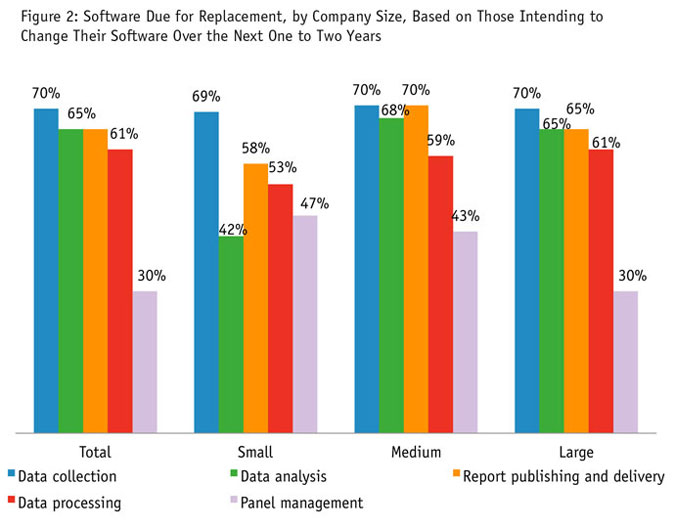
New data collection software comes at the top of everyone’s wish list, with little variation between companies of different sizes, but there is a much greater desire to seek out new data analysis and also report-publishing tools among the larger firms.
We read these high values as an indication of dissatisfaction with some of the tools currently in place and speculate that there is some frustration among research companies with the development trajectory in some of the more established software tools.
Views on mobile survey takers
Figure 3 contains information that no research company doing online research can afford to ignore. With so many people now owning smartphones and a growing number choosing to take Web surveys on them, we wanted to know how market research companies were facing up to this disruptive phenomenon in their survey design.
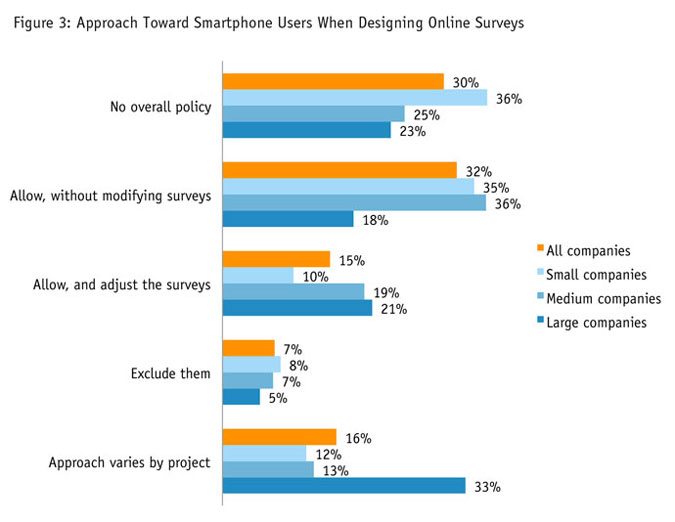
We were taken aback to see that so many market research companies are excluding mobile survey takers from their surveys. While only 7 percent state they actively block mobile survey takers – which in itself is not a neutral decision from either a sampling or respondent cooperation standpoint – the 30 percent who have set no overall policy and the 32 percent who allow them in without modifying the survey will be excluding all but a handful of respondents. Surveys do not auto-optimize to present themselves on small screens. In fact, optimizing surveys involves effort and cost, and the rather bloated surveys that have become commonplace in online research do not translate well to mobile.
We did also provide another option that has been discussed at industry events: to route participants to a specific survey designed for mobile participation. This appears not to be used by research firms at present as nobody selected this option.
In a separate question, we obtained firms’ estimates of how many participants were typically attempting their surveys on smartphones and other mobile devices. An overall level of 6.7 percent across the whole sample breaks down to 9.4 percent for large companies, 7.1 percent for mid-size companies and 5.4 percent for small firms.
As it happens, our survey had been optimized for mobile, but only 3.5 percent chose this route. The proportion on any survey does appear to vary widely both in relation to how tech-savvy the group is and also how habituated they to taking surveys. Anecdotally, we hear panel members are less likely to use smartphones to respond than on some general-population or customer surveys where the proportion is much higher. We suspect our own sample was also habituated to using a PC to respond.
For online research, this is disruptive technology at work. A rapidly increasing proportion of e-mail traffic is now being opened and read only on mobile devices. E-mail messages with an embedded link to a survey remains the most prevalent means to invite respondents to a survey. Online research practice needs to change quickly, in order to move with the times and turn what is starting to look like another threat into an opportunity.
Technology for data visualization
We asked our survey participants how much growth they were expecting in data visualization that goes beyond simple charting. It is very clear from this chart that companies of all sizes in all regions are experiencing growth – especially large companies.
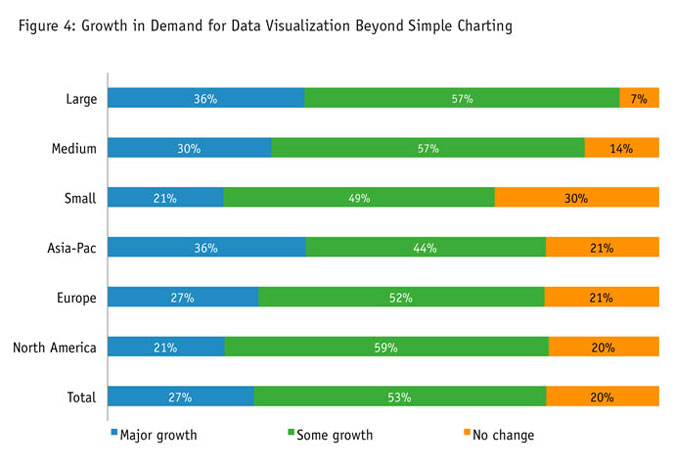
To produce the more informative, imaginative visualizations, market research companies would be better off turning to dashboard tools and specialist charting tools than relying simply on Excel and PowerPoint. Here too, research companies seem ill-equipped to deal with the challenge. In another question we found that only about a third (34 percent) are turning to specialist dashboard software and even fewer (20 percent) ever use specialist charting software. Nearly all companies (96 percent) claim that they are using Excel and PowerPoint for almost all of their data viz work. Not only are these tools not up to the task – which many respondents admitted, in an open text question – but it is not the approach used by other data providers, consulting firms or publishers, where a range of tools tend to be used.
Who produces data visualizations?
Creating top-quality, imaginative visualizations is a specialist skill and requires more than just specialist technology. So, we asked who within market research companies produces data visualizations.
In all regions, researchers are most likely to be creating visualizations but it looks as if companies in Asia-Pacific have taken steps to engage more specialists such as charting specialists, graphic artists and visual designers.
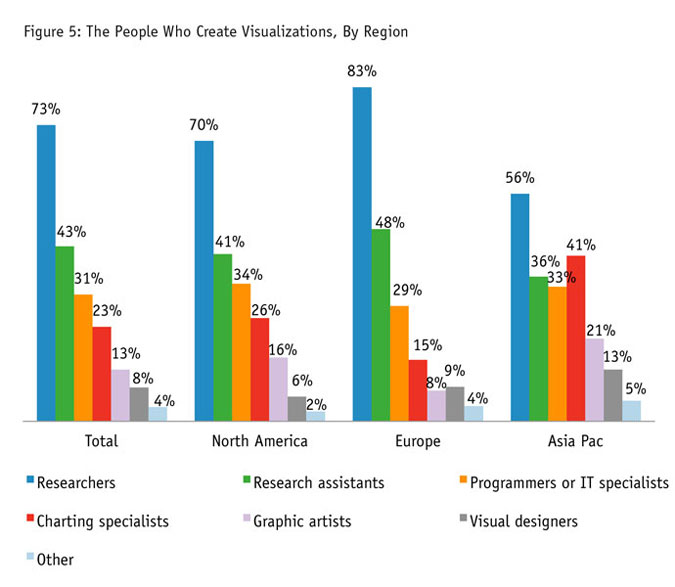
This apparent lack of specialist skills, especially in North America and Europe, may be a clue as to why so few companies have the confidence to move beyond Excel and PowerPoint. However, to move forward, market research firms need to focus not only on the technology but in acquiring or developing the right skills to communicate data more effectively in visual form.
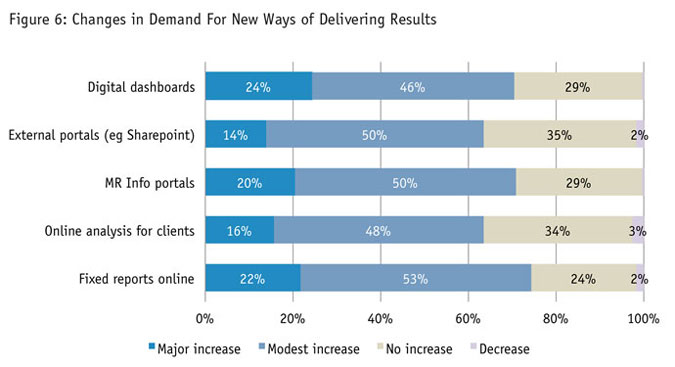
The future for digital deliverables
We asked companies about their anticipated change in demand for various online results delivery methods. The hotspots for growth identified are in the area of dashboard delivery, closely followed by fixed online reports and portals.
However, this contrasts with current practice revealed in another question, which shows that the most prevalent delivery methods are largely unchanged over the last five years. PowerPoint continues to dominate as a publishing as well as a presentation method: It is used to deliver 53 percent of all projects. Following this comes Acrobat (20 percent) and Microsoft Word (17 percent). So the top three are all relatively low-tech delivery methods. Dashboards, although tipped for major growth by our participants, are also reported by them to account for just 7 percent of project deliverables. However, this is not a method that is necessarily appropriate to all projects.
Engagement with new MR methods
The set of techniques referred to as “new MR” seems to have gained real traction in the industry, with our survey participants estimating that a total of 9.1 percent of their research today is based on new MR methods. This figure does vary considerably by company size, with small companies putting this figure at 7.0 percent and large companies 12.3 percent.
We trawled through conference presentations, blogs and reports in the media to identify different kinds of new MR activity and, having identified seven, we asked about the level of activity for each of these. The response shows considerable variation in the popularity of each of these methods. The methods closest to conventional research – communities and Web scraping – account for most activity. So too does digital ethnography, with one in five firms earning revenues from this, which is another new take on an established method.
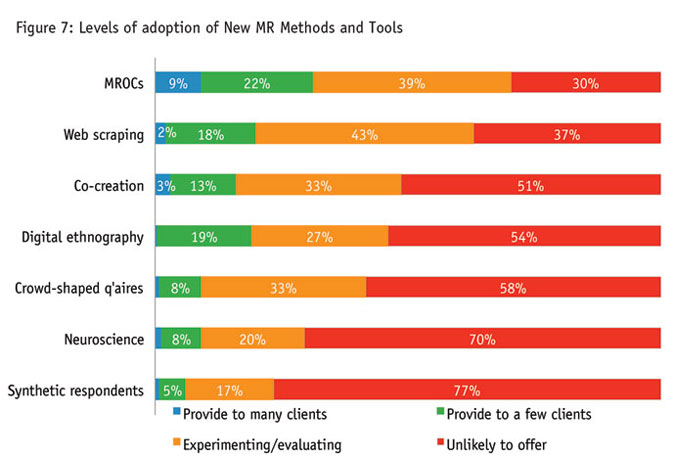
Co-creation comes highest among the novel methods; the others appear to be the preserve of specialists. Very few companies are using synthetic respondents (or artificially-created Web bots) that interact through social media sites.
When the methods are broken down by company size, it is again the large companies that dominate the more innovative methods, with the exception of MROCs, which is already fairly extensively used by small companies too.
The effect of new MR on old MR
Not only is new MR now making up a substantial part of the MR repertoire, other questions in our study seem to indicate that new MR revenues are not necessarily cannibalizing conventional quant or qual revenues. Without specifically mentioning new MR, we asked if firms were experiencing any decline in overall revenue for conventional quantitative research. Opinions seem to split into three groups worldwide – almost one-third seeing a drop, almost one-third seeing continued growth and the rest seeing no change. However, in North America, there are many more witnessing continued growth and fewer seeing either reduction or no change.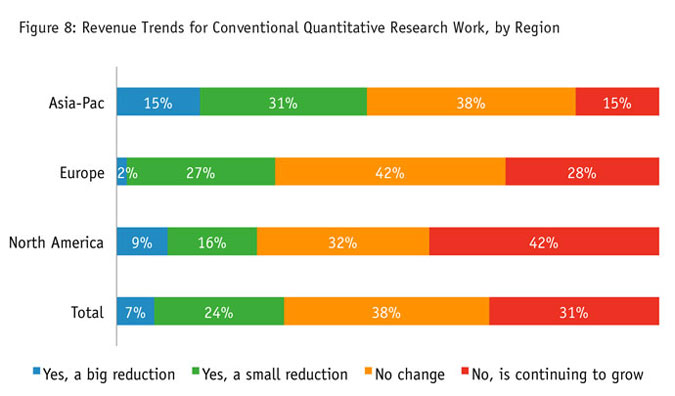
We followed up those who stated some kind of reduction to ask what they attributed this to. “Business switching to new MR” came third in the reasons cited, behind clients working to reduced budgets and general economic uncertainty.