
Integrating theory and measurement
Editor's note: Madhuri Pawar is analyst, market research, with KMK Consulting Inc., a Morristown, N.J., research firm.
 Over time, psychologists have integrated numerous theories and frameworks to develop models to predict and influence human behavior. As better approaches to understanding the human psyche emerge, these models are adapted and improved (thus, they tend to evolve). These models can be used by market researchers to better understand consumer decision-making and thereby create programs that could influence behaviors.
At the heart of these models are causal modeling techniques. Causal modeling is now recognized as a general approach for integrating theory with measurement elements of research. Previous research suggest that causal models provide four key benefits: 1) they make the assumptions, constructs and hypothesized relationships in a researcher’s theory explicit; 2) they add a degree of precision to a researcher’s theory since they require clear definitions of constructs, operationalization and the functional relationships between constructs; 3) they permit a more complete representation of complex theories; and 4) they provide a formal framework for constructing and testing both theories and measures.
In short, causal models allow market researchers to develop explanations using strong analytic techniques.
Encouraging behavior change
It is known that patients can make positive contributions to their own health by adopting particular heath-enhancing behaviors. Therefore, determining behaviors that influence health – and understanding factors that underlie these behaviors – has become key in the area of health psychology. Many theories have been developed and integrated to understand patient behavior. Understanding the determinants of behavior may be best approached by using theoretical models of human motivation. Further, identifying factors that drive or impede behavior can help in developing interventions and encouraging behavior change.
Some of the models that have been developed to predict and change health behavior include the health belief model, social cognition model and the protection motivation theory, amongst others. However, use of these models in commercial health care research has been limited, specifically in the area of quantitative research, because such studies will require conceptual work to determine what the key variables are. Further, the advanced analytical approaches needed to analyze the data can be challenging. Hence, in this article we discuss the use one behavioral model, COM-B, within the context of Type 2 diabetes, which can help overcome the above obstacles for its use in commercial research and give direction towards identifying and testing variables that effect behavior.
The article discusses the following areas (taken from an original research conducted among Type 2 diabetes patients):
- how the use of one behavior change model, COM-B, can help in understanding determinants of important health behaviors among Type 2 diabetes patients;
- demonstrate an approach to analyze drivers of behavior using causal modeling;
- discuss analytic considerations in using behavior change models.
The COM-B model
The development of behavior change models results in identifying and categorizing various factors that underlie important behaviors. The COM-B model takes into consideration three psychological factors that explain human behavior, which are linked to fruitful targets for developing interventions. According to the model, three components – capability, opportunity and motivation – interact to generate behavior that in turn influences these components (the COM-B system) as seen in Figure 1. This model hypothesizes that behavior is part of an interactive system involving all these components. It also explains why certain behaviors are not engaged in. The model can be used as a starting point to design interventions that address each of these components, depending on its importance in influencing a specific behavior.
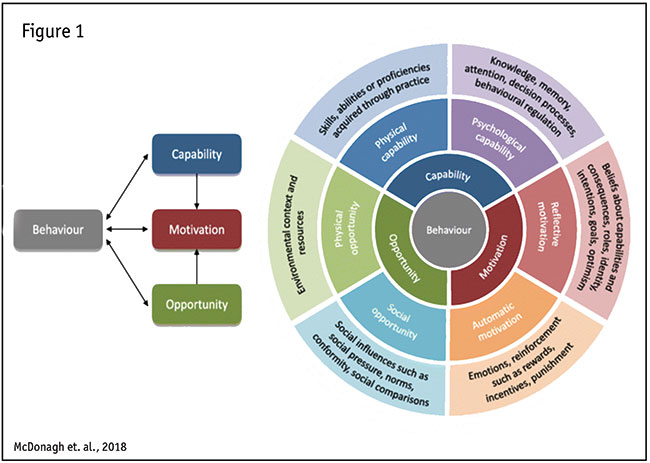
Capability is defined as the individual’s psychological and physical capacity to engage in a specific activity. It includes having the necessary knowledge and skills to perform a behavior. Opportunity is defined as all the factors outside the individual that make the behavior possible or prompt it. This includes the individual’s physical and social environment and external resources available to them. Motivation comprises all those brain processes that energize and direct behavior, not just goals and conscious decision-making. This includes habitual processes, emotional responding, as well as analytical decision-making.
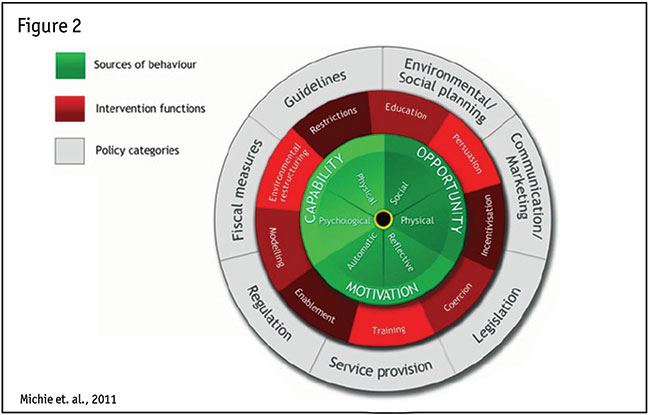
We chose the COM-B model because it is comprehensive and dynamic, where several distinct explanatory components are outlined that influence the COM attributes; thus, additional potential influences on behavior can be considered and can be applicable to all behaviors. Additionally, this dynamic framework also explains how the performance of behavior can in turn influence the COM attributes. COM-B lies at the center of the behavior change wheel (BCW), Figure 2, a toolkit for designing behavior change interventions, and is the starting point of intervention development. COM-B components can be mapped onto the BCW and the behavior change technique taxonomy which facilitates the selection of intervention strategies that are likely to be appropriate and effective in addressing the barriers and facilitators for each component.
Application of the COM-B model – case study with Type 2 diabetes patients
Apart from taking medications, self-care measures are crucial for diabetes management. Because the vast majority of day-to-day care in diabetes is handled by patients, there is an important need to understand and measure the influences of self-management of the condition. There are seven essential self-care behaviors in people with diabetes which predict good outcomes. These are: healthy eating, being physically active, monitoring of blood sugar, adherence to medications, joining support groups, nutritional counseling and using health-related apps. To understand the influences of these behaviors, we used the psychological model, COM-B. Along with understanding the factors, the model can also help in designing interventions that encourage behavior change.
Participants in this study were recruited for a web-based survey from a U.S. consumer research panel. A total of 1,698 respondents participated in the study. All respondents reported that they had been diagnosed by a physician with Type 2 diabetes. Quotas were set to make the sample representative of the U.S. Type 2 diabetes population.
Operationalizing COM-B for Type 2 diabetes
Composite variables representing the three domains in the COM-B model were created. Comprehensive reviews from previous qualitative and quantitative studies of health behaviors among patients were used to identify and map different factors associated with behaviors as listed in Table 1.
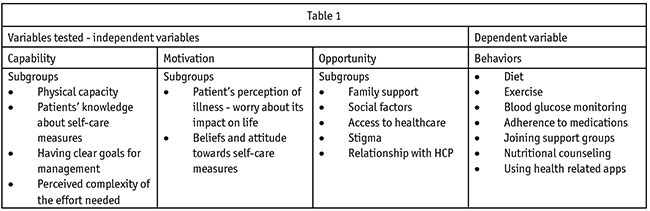
For capability, physical and psychological capability were measured by asking about the respondents’ physical capacity, knowledge about self-care measures, goals for management and complexity of the effort needed. Opportunity was measured using variables that represent extent of family support, social factors, stigma and relationship with HCP. Motivation was measured using variables that represent patients’ perception of illness, beliefs and attitude towards self-care measures and outcome expectations. These independent variables were included in the survey as statements to which respondents answer with their agreement using a five-point agreement scale, where 1 was “strongly disagree” and 5 was “strongly agree.”
We analyzed the internal consistency of the constructs and their subgroups using Cronbach alpha scores. This estimates the reliability of the instrument by measuring the internal consistency of the items. It also helps to identify troublesome items. Further, the validity of each subgroup suggested in the theory was checked using confirmatory factor analysis. The dependent variables (behaviors) used in the survey were dichotomous (yes/no). The analysis for each behavior was performed individually.
Path analysis with logistic regression
Data were analyzed through path analysis with logistic regression using IBM SPSS Statistics. Path analysis is used to evaluate causal models, allowing for a richer understanding of the relationships between and among the examined variables. There are several advantages to path analysis that account for its continuing popularity: 1) it provides a graphical representation of a set of algebraic relationships among variables that concisely and visually summarizes those relationships; 2) it allows us not only to examine the direct impact of a predictor on a dependent variable but also to explore other types of relationships, including indirect and spurious relationships; 3) it indicates, at a glance, which predictors appear to have stronger, weaker or no relationships with the dependent variable. Logistic regression allows for prediction of the dichotomous dependent variable Y based on a collection of X variables. We then used the standardized beta scores as input for showing the impact in path analysis.
The analysis was done in three steps.
Step 1: Direct effect. First, we examined the direct effect of the independent variables (capability, opportunity and motivation) on the dependent variable (behavior) using logistic regression. We also examined the effect of capability and opportunity on motivation using linear regression, as suggested in the COM-B framework.
Step 2: Indirect effect. We then calculated the indirect effect of the independent variables (capability and opportunity) on behavior through its effect on the other independent variable (motivation) as suggested in the model (i.e., indirect effect of capability and opportunity via motivation on behavior).
Step 3: Effect of subgroups on behavior. We ran logistic regression to see the effect of each subgroup within the three constructs on behavior
Results
Different regression analyses were performed to obtain the beta coefficients needed to populate the path diagram and check the statistical significance of direct effects for each dependent variable. The details of the regression analyses are presented here, reporting beta coefficients.
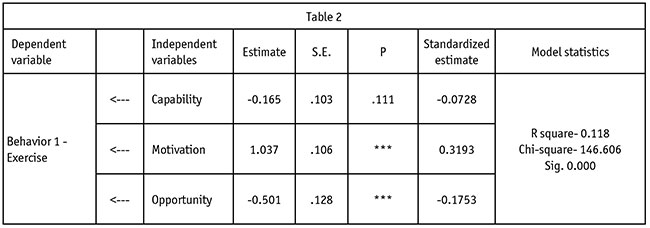
Table 2 shows the direct effect of the three independent variables on exercise. This regression model is significant overall (p<0.01) and the variables account for 11% (R-squared) of variance on Behavior 1 - exercise. Motivation and opportunity (p<0.05) are significant predictors in this model.
Further, the model suggests that motivation is influenced by capability and opportunity. To confirm, we ran linear regression to see the effect of capability and opportunity on motivation, shown in Table 3. It appears that capability and opportunity (p<0.05) are significant predictors of motivation.
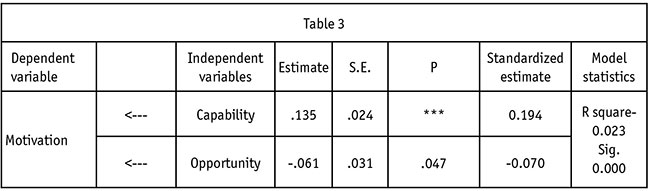
From this, we calculated the indirect effects of capability and opportunity on behavior. The approach used in calculating the indirect effect coefficients for path analysis models is to first regress the last variable in the causal order on the prior two variables, then to regress each endogenous variable in turn, working back from the last to the second variable in the sequence, on the variables that precede it in the model. We use the standardized coefficients in this. Example shown below:
Indirect effect
Capability to motivation to behavior (exercise) = (0.194) (0.3193) = 0.0619
Opportunity to motivation to behavior (exercise) = (-0.070) (0.3193) = -0.02235
Total effect
Capability to behavior = (-0.0728) + (0.0619) = -0.0109
Opportunity to behavior = (-0.1753) + (-0.02235) = -0.19765
Additionally, we also analyzed the impact of each subgroup within motivation and opportunity on behavior. As shown in Table 4, we see that motivation in terms of beliefs towards self-care measures (p<0.01) has the most influence on behavior (exercise). Apart from that illness perception (p<0.01), family support (p<0.01) and stigma (p<0.01) are significant contributors. 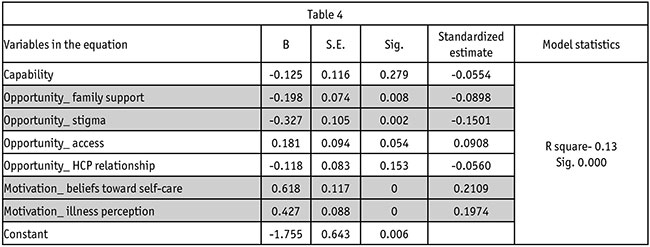
Similar to the above analysis, we ran logistic regression for each behavior. We saw that diet, blood glucose monitoring and adherence are significantly impacted by motivation (both beliefs toward self-care and illness perception) and opportunity (when measured collectively but no significant effect of individual attributes when broken down in step three). Participation in support groups is affected by motivation (when measured collectively and only by illness perception when broken down in step three) and opportunity (when measured collectively and only by access to health care when broken down). Nutrition counseling is influenced by capability and motivation (both beliefs towards self-care and illness perception) and by opportunity (when measured collectively and only by stigma and family support when broken down in step three). Finally, use of apps is influenced by motivation (both beliefs toward self-care and illness perception) and only by family support within opportunity.
From the analysis we see that important activities like diet, blood glucose monitoring and adherence are significantly influenced by both attributes of motivation and by opportunity when measured collectively. However, additional behaviors like participation in support groups, nutritional counselling and app use is affected by individual opportunity attributes like access, stigma, family support and even capability (specifically for app use), in addition to motivation attributes. Developing interventions using the behavior change wheel to target these factors can encourage these health behaviors.
All the COM-B models tested above (for each behavior) are statistically significant. In the case of low R-squares, it is possible that additional predictors within capability, opportunity and motivation could increase the explanatory power of the model. However, in other cases, the data contain an inherently higher amount of unexplainable variability. Nevertheless, p-values still indicate significant relationship between predictors and the response variable in the causal model and can be used to design interventions to target the important predictors.
Better understand the factors
Causal models, like COM-B, can provide a strong theoretical background for building questionnaires which can help commercial market researchers to better understand the factors that underlie specific behaviors (like product or service usage, preference for a product category etc.). These insights can be leveraged to design interventions that address the factors identified to improve adoption of those behaviors. The approach used in this research for examining factors and analyzing causality provides a potential template in how these models could be effectively incorporated into commercial market research. While path analysis has traditionally been used in this context, analyzing this or other behavioral models utilizing newer approaches like Bayesian networks may also be worthwhile. Researchers could also explore the use of this model in non-health care settings to help develop interventions that meet customer requirements and encourage specific behaviors.
References
Hulland, J., Chow, Y. H., & Lam, S. (1996). “Use of causal models in marketing research: A review.” International Journal of Research in Marketing, 13(2), 181-197.
Jackson, C., Eliasson, L., Barber, N., & Weinman, J. (2014). “Applying COM-B to medication adherence: a suggested framework for research and interventions.” European Health Psychologist, 16(1), 7-17.
McDonagh, L.K., Saunders, J.M., Cassell, J., Curtis, T., Bastaki, H., Hartney, T., & Rait, G. (2018). “Application of the COM-B model to barriers and facilitators to chlamydia testing in general practice for young people and primary care practitioners: a systematic review.” Implementation Science, 13(1), 130.
Michie, S., Van Stralen, M.M., & West, R. (2011). “The behaviour change wheel: a new method for characterising and designing behaviour change interventions.” Implementation Science, 6(1), 42.
“Path analysis with logistic regression (palr).” (2010). In Menard, S. “Logistic Regression: From Introductory to Advanced Concepts And Applications” (pp. 145-170). Thousand Oaks, CA: SAGE Publications, Inc. doi: 10.4135/9781483348964
Wing, R.R., Goldstein, M.G., Acton, K.J., Birch, L.L., Jakicic, J.M., Sallis, J.F., ... & Surwit, R.S. (2001). “Behavioral science research in diabetes: lifestyle changes related to obesity, eating behavior, and physical activity.” Diabetes Care, 24(1), 117-123.