
Fair market value part II
Editor's note: Lynn Clement is chief research officer at KJT Group Inc., a Honeoye Falls, N.Y., research firm. Chris Claeys is senior director analytics and consulting KJT Group Inc. The authors gratefully acknowledge Jerry Arbittier and Brian Fischer of SurveyHealthcare for the data collection and their input in the interpretation of the results.
 Fair market value (FMV) is a challenging issue, one that complicates the research process and can be felt at every level of our industry. As the demand for insights increases, the pressure to control compensation has also increased. Our previous research (“What’s fair? “Quirk’s, April/May 2019) provided evidence-based guidance around the appropriate incentive levels for several specific physician specialties.
While physicians remain an important stakeholder in product decisions, there has been an increased emphasis on other non-physician roles. Our research on health care purchase decisions has consistently shown less concentration around decision-making, with roles such as procurement, nurses, nurse managers, biomedical engineering and pharmacy gaining more and more influence. As these roles historically have not been the focus of survey research, there is little evidence around what they expect to be paid for participation. In addition, they tend to be less empaneled than their physician counterparts, leading to a more difficult recruit. Little is known about their participation rates and a review of our clients’ FMV suggests there is an even larger gap between clients’ FMV and expected compensation, particularly among C-suite roles. Similar to the previous wave, this research was constructed to understand fair market value for these non-physician roles and the impact of below-market compensation on participation rates.
Fair market value is the price, expressed in terms of cash equivalents, at which property would change hands between a hypothetical willing and able buyer and hypothetical willing and able seller, acting at arm’s length in an open and unrestricted market, where neither is under compulsion to buy or sell and when both have reasonable knowledge of the relevant facts.1
The three universally accepted approaches to determining FMV are2:
The market approach, or “a general way of determining a value indication of a business, business ownership interest, security or intangible asset using one or more methods that convert anticipated economic benefits into a present single amount.”
The cost approach, or “a general way of determining a value indication of an individual asset by quantifying the amount of money required to replace the future service capability of that asset.” The cost approach is based upon the principle of substitution – the premise that a prudent individual will pay no more for a property than he/she would pay to acquire a substitute property with the same utility.
And finally, the income approach, or “a general way of determining a value indication using one or more methods that compare the subject to similar businesses, business ownership interests, securities or intangible assets that have been sold.”
For our industry, the market approach is the most reasonable but it is still complex. Arrangements are typically quite diverse and may not offer perfect comparables. As identified in the previous article, while there are vendors that specialize in assisting manufacturers with determining FMV, they typically focus on consulting engagements, not market research, where the value of their insights is difficult to quantify.
Sets their own
Currently, there is no universal standard or methodology for determining FMV for market research due to the complexities and variance of study design and respondent requirements. Each supplier and manufacturer sets their own FMV, balancing study criteria and response rate. The overarching goal in developing FMV is to identify and limit potential conflicts of interest without compromising the integrity of the research.
As there is no standard approach nor published guidance on the impact of compensation on participation, each manufacturer undertakes the process differently, yielding diverse results. In addition to highly variable FMV rates across manufacturers, we see several other distinct challenges such as: rates that were developed many years ago and are not adjusted for inflation or other market factors; tiered incentives for respondents with differing credentials or years of experience within the same study; and the approach of one standard hourly rate whereby the actual honorarium is calculated based on the time commitment, with no adjustments for methodology, incidence rate or universe size.
When creating your fair market value guidance, it is critical to steer away from one standard hourly rate. While it is impossible to determine FMV guidance for every possible research commitment, your FMV guidance should take into consideration several important engagement factors that impact participation rates:
Type of study or methodology. A typical qualitative interview or focus group is a more intensive research commitment, with a structured interview time, requiring a different and deeper level of focus and engagement than a quantitative study. Per-minute compensation should be higher than a quantitative study.
Input required. The complexity of the research study warrants consideration. A tracking study, standard message testing or simple rating-and-ranking exercise is less demanding than a more rigorous conjoint or choice exercise study.
Expected or required time. An easy 10-minute quantitative survey can offer a low incentive and still be attractive. As the time commitment increases to 30 minutes or longer, participation and interest drops. A straight-line increase in incentives corresponding to the time commitment will not optimize quality or participation rates.
Quota size vs. population size of specialty. One challenge that most clients fail to consider is the screening criteria and their impact on recruitment and participation. If you are targeting a procurement professional with minimal screening criteria and a high qualification rate (75% or above), a lower incentive may be acceptable. However, if you layer on multiple screening criteria and the incidence rate is low (<20%), you may need to screen through many procurement professionals to achieve your desired completed interviews. As they are also less likely to be in panels, you should consider increasing the incentive to maximize the response rate to achieve your goals.
Requirement to use a manufacturer target list. Most market research studies are completed using online panels, a group of health care professionals who have opted in to participate in research. When the universe is limited to a specific target list, we are limiting the number of targets within a panel that can be sampled. The impact is a much smaller group of respondents to target. In addition, although manufacturers might have a target list for recruitment it is typically at the facility level and does not include respondent name or contact information, making the recruitment process even more difficult. This either requires more custom recruiting using non-panel approaches, optimizing the response rate to the invitation by increasing the honorarium to make the research opportunity more attractive, or both.
How often a specialty is researched. The focus for this wave of the research is on non-traditional respondent types, like biomedical engineers, lab managers, quality staff, care managers, compounding pharmacists, procurement managers, etc. As their level of influence on procurement decisions increases so too does the demand for their insights. The challenge is that these roles historically have not been heavily researched or empaneled and, as a result, are much harder to recruit. Although their feedback is desired, typically the incentives offered are lower than what we see for physicians. This, compounded with access challenges, makes it critical to optimize the response rate to a research invitation.
So, overall, what is the impact of declining and highly variable FMV rates?
-- Low response rates, in an industry where the response rates have historically been declining.
-- Achieve less than desired number of completed interviews.
-- Longer field period to achieve the desired number of completed interviews.
-- Potential for respondent pool to be less representative of targets than desired due to selection bias because of the offered honoraria.
-- Vendor masking of actual incentive amounts to ensure they can meet the desired number of completed interviews (rolled into recruit fee, travel stipend, etc.). This creates a lack of transparency in a highly competitive market, representing an ethical dilemma. Masking incentive amounts does not support the greater cause of fair compensation for respondents. If we cannot prove the FMV rates of a manufacturer are too low, we are not assisting our client partners in making the case for adjusting them.
-- Panel partner refusal to conduct the recruit due to the impact on panelist relations from offering below market-rate honorarium.
Overall this leads to suboptimal outcomes that impact the quality of the insights and client confidence in decision-making and strategic direction. Due to these issues, we decided to conduct an in-depth study of FMV rates. The key questions we sought to answer were:
- What do non-physician roles expect to be compensated for different types of research engagements?
- Is the average FMV rate adequate to achieve an acceptable level of participation (75%) in each type of research study?
- Does years in role, facility type or frequency of participation in market research impact willingness to participate at different incentive levels?
- And, lastly, are non-physician roles more willing to participate in certain types of research engagements than others?
Methodology
To answer these key questions, we developed a questionnaire that elicited likelihood of participation in varying market research studies at varying incentive amounts among C-suites, procurement, pharmacy directors, pharmacists, NPs/PAs, nurse managers and nurses. On average, the questionnaire was seven minutes in length and was fielded April 3-24, 2019. We recruited from a convenience sample randomly drawn from KJT Group’s ClinicalVoice Community and SurveyHealthcare’s online panel. In total, 87,311 pieces of sample were sent with 625 physicians responding and 425 completing the survey. Initially, respondents were not offered an incentive for completion; however, a small $10 incentive was offered toward the end of fielding to achieve the necessary sample sizes. To qualify for the research, respondents had to be in a qualified role with more than one year in that role. Sub-quotas were developed and monitored for years in role and setting, to ensure adequate representation.
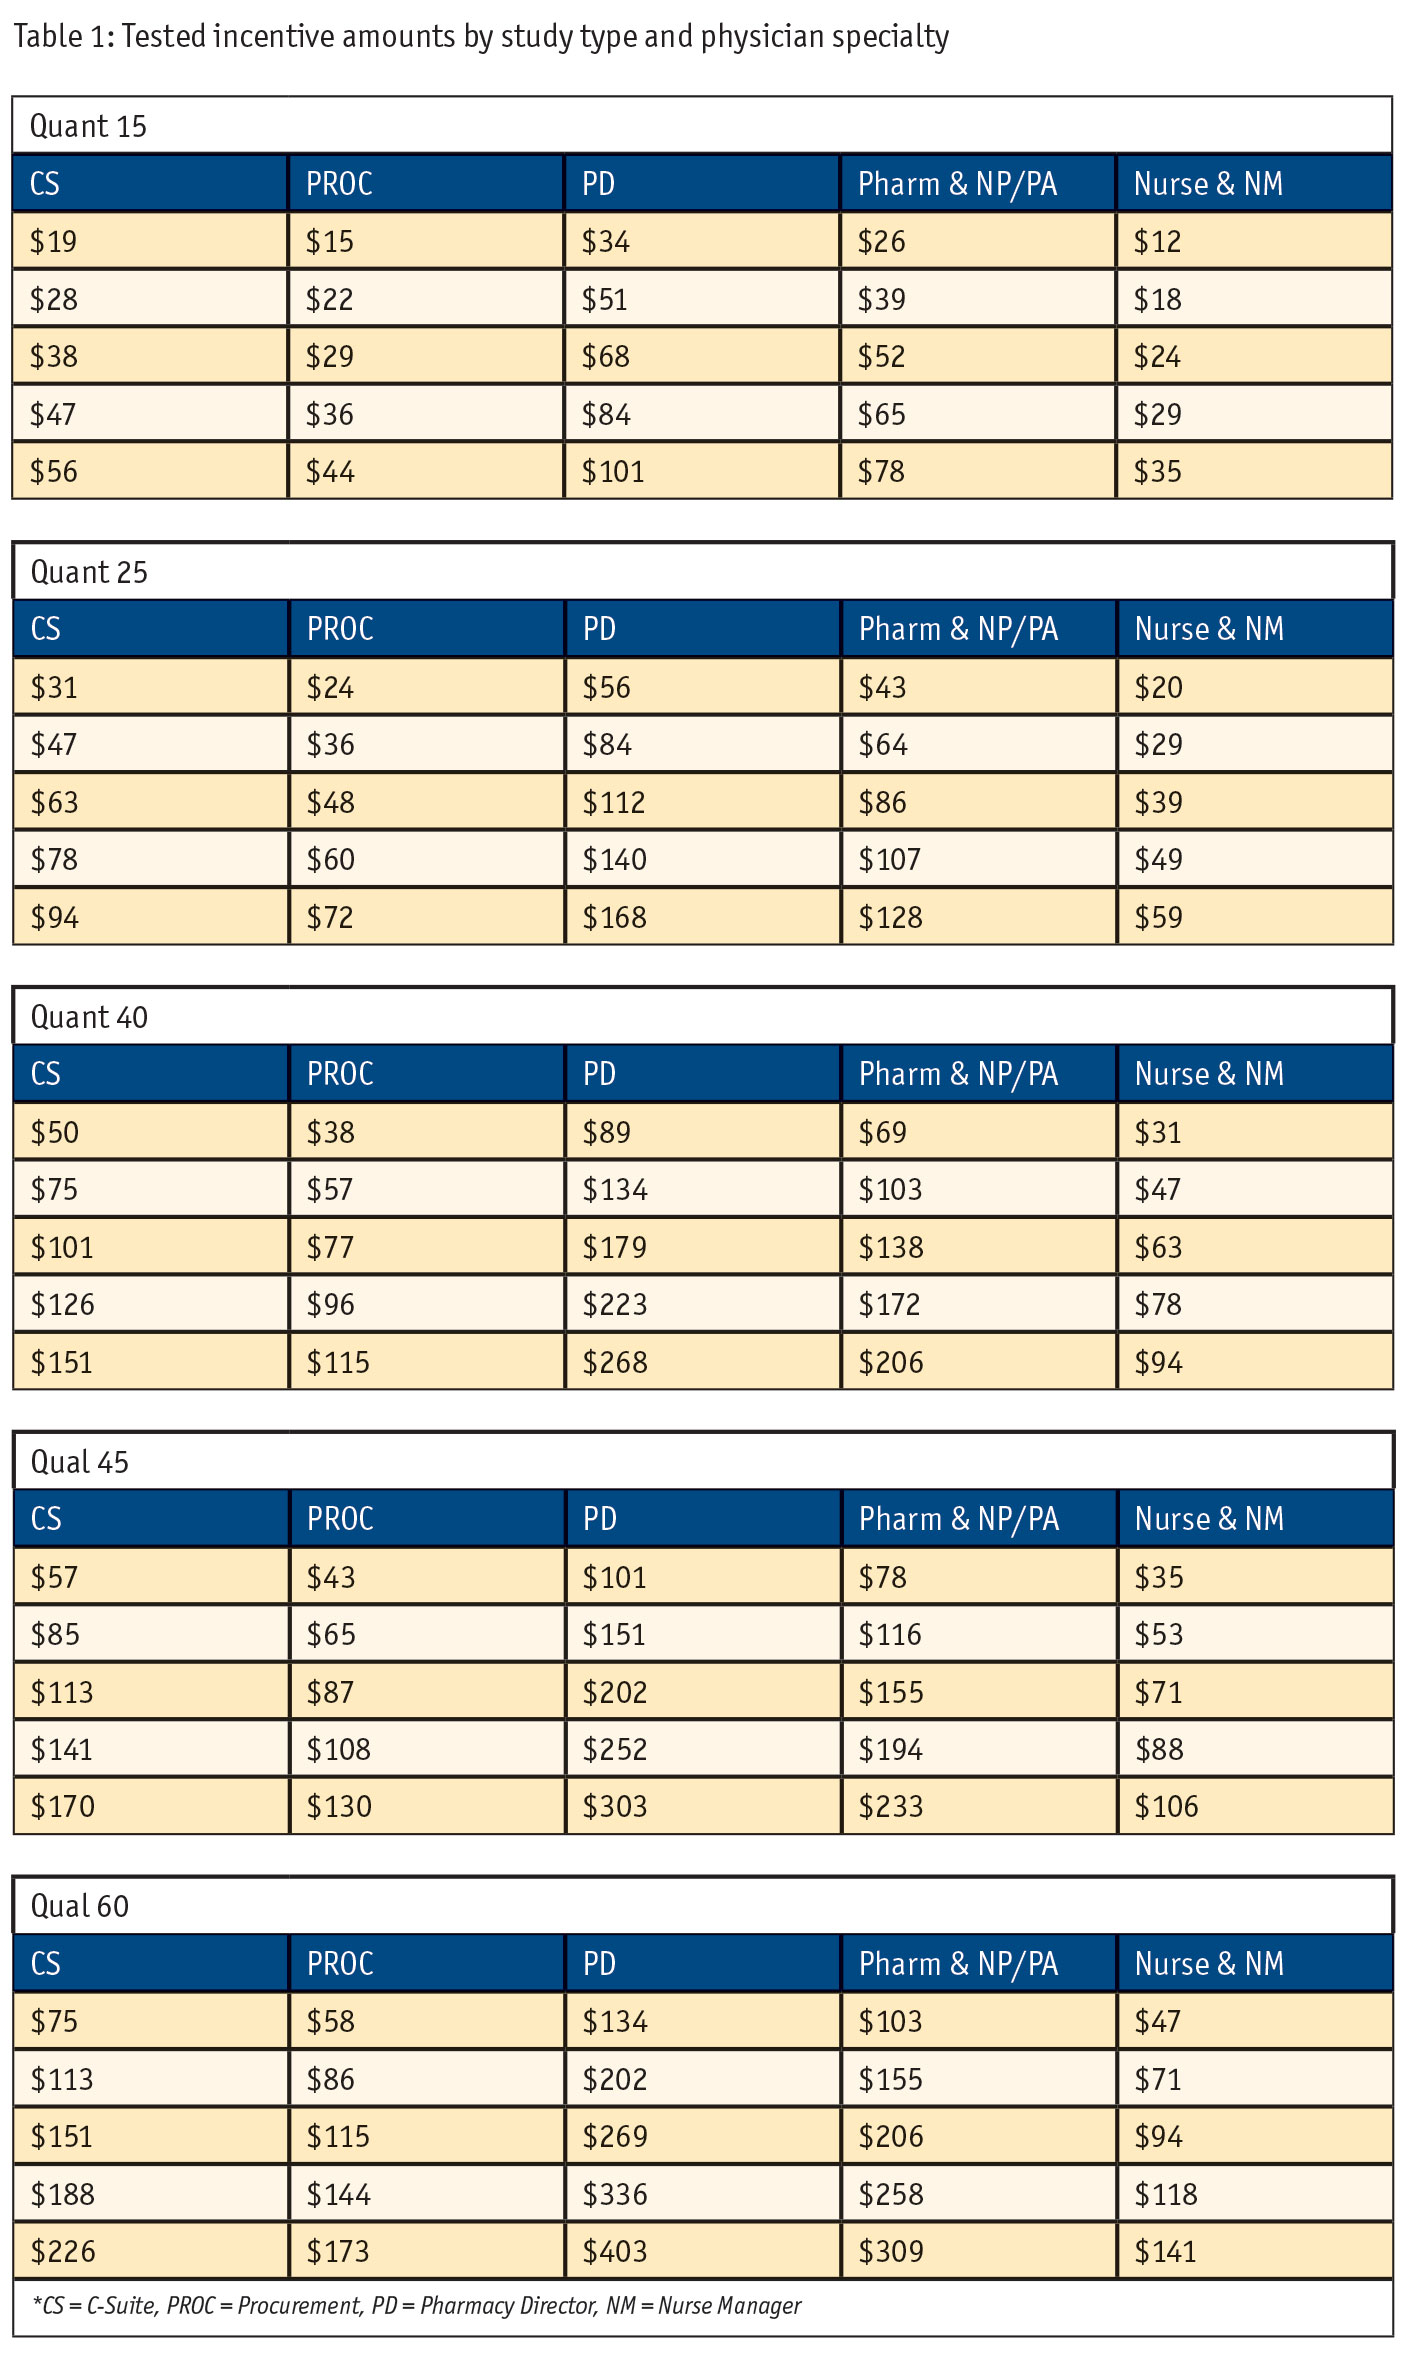
The questionnaire specifically tested receptivity to varying incentive amounts for five types of market research studies: 1) 15-minute online quantitative survey (Quant 15), 2) 25-minute online quantitative survey (Quant 25), 3) 40-minute online quantitative survey (Quant 40), 4) 45-minute qualitative telephone in-depth interview (TIDI) (Qual 45), and 5) 60-minute qualitative in-person in-depth interview (IDI) (Qual 60). Incentive amounts varied for each role within each study type, with higher incentive amounts offered for studies requiring a greater time commitment. Exact incentive amounts (Table 1) were determined as a range (±50%, ±25%) around our clients’ average FMV rate for each role by study combination; the middle price point was always the average FMV rate. To elicit participation likelihood, a Gabor-Granger3 exercise was utilized. (Gabor-Granger is a sequential monadic method typically used for estimating price elasticity of a product or service. In this application, we used it to estimate incentive elasticity of market research participation.)
For each study type, respondents were shown a description of the study they’d be participating in, the average incentive amount and asked if they would participate. If they responded “yes,” they were shown a lower amount; if they said “no,” they were shown a higher amount. This repeated until the respondent reached either the end of the incentive range or until their reservation amount was reached. The order in which respondents were shown the five market research studies was randomized to avoid bias.
To formally test the impact of incentive amount on participation given study type and role, an analysis of variance (ANOVA) was utilized with reservation price as the dependent variable and study type and role as the independent variables. Given this analytic plan, sample sizes for the seven roles were determined a priori as n = 45 to provide adequate statistical power (80%). Our final sample sizes met this requirement with n = 45 for all roles except for pharmacy directors, which had n = 47.
Additional hypothesis testing on years in role (< 10, 10-19, 20+ years), practice type (hospital, office, other) and frequency of participation in market research in the past 30 days (0 studies, 1-2 studies, 3+ studies) were not considered in the determination of sample sizes since these factors could not be sampled to and therefore could not be balanced and were not used in the designed experiment. These factors were tested using an F-test, in a more exploratory nature and independent of other factors.
Results
ANOVA results for the Gabor-Granger data are in Table 2 for main effects and two-way interaction terms. Notably, all main effects are statistically significant, while the two-way interaction is insignificant and with negligible effect size (Cohen’s F). While the main effect of role is significant it, too, has a small effect size. This indicates that while the incentive decision makers expect to be paid varies by role, there are few meaningful differences by role with respect to the baseline FMV incentives tested in the research. For example, if incentives should be altered, they should be increased or decreased by the same proportion across all decision-making roles.
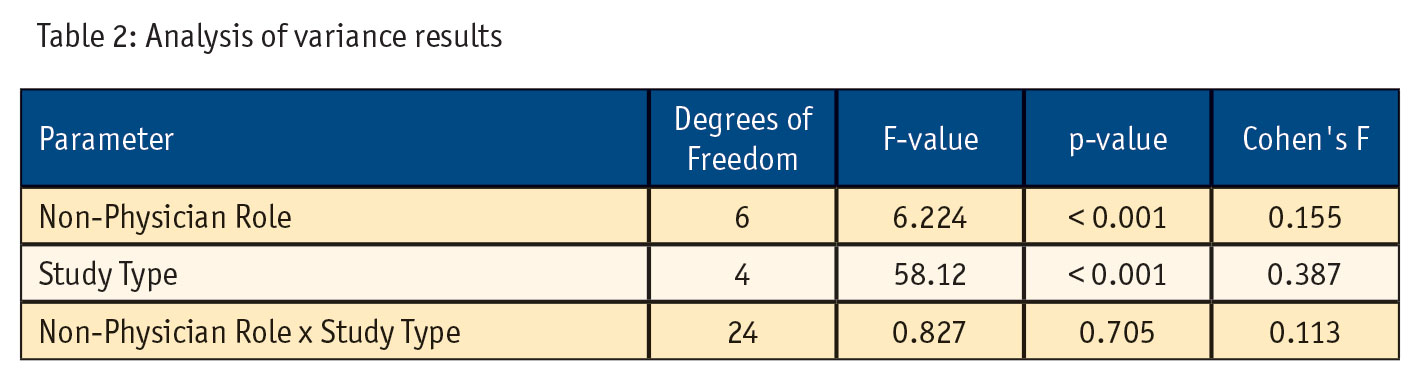
Post hoc analysis of pairwise differences for study type indicates that higher FMV rates are expected for both 45-minute and 60-minute qualitative studies as compared with 15-, 25- and 40-minute quantitative studies and for 60-minute qualitative studies as compared to 45-minute qualitative studies (p < 0.001 for all comparisons).
Separate F-tests assessed the independent impact of years in role, practice type and frequency of participation in market research in the past 30 days. Significant differences existed for < 10 years in role as compared to 20+ years (p < 0.001) with 20+ years requiring, on average, a 14% higher incentive amount. Significant differences also existed between cohorts of market research participation with those who have participated in three or more studies over the past 30 days requiring, on average, a 14% higher incentive than those who have participated in no studies (p = .003). No significant differences were found by practice type.
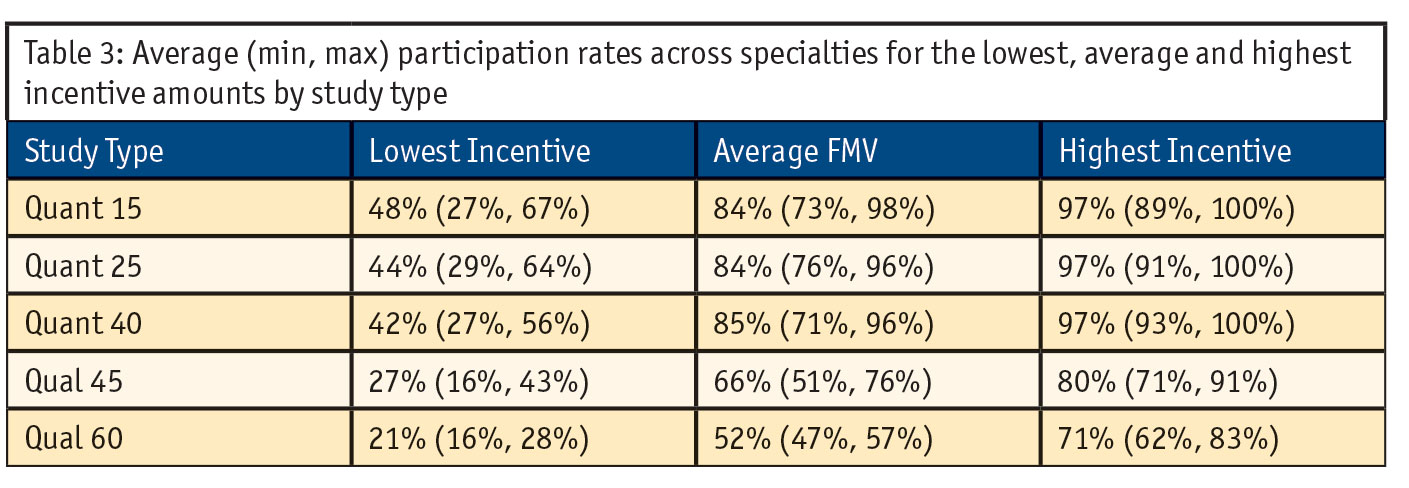
Turning to participation rates (Table 3), we see that online quantitative studies have the highest participation rate at the average FMV. For all study types the average participation rate drops below 50% at the lowest incentive amount. Further, when comparing the 40-minute online quant versus the 45-minute TIDI we see a large difference in participation rates across all incentive amounts. While the 45-minute TIDI receives a higher incentive for the additional five minutes of time (~$14 on average) this is not enough to compensate for the effort and scheduling commitment required for a TIDI. Similarly, while respondents receive a higher incentive for a 60-minute in-person IDI (~$42 on average) we see even lower relative participation rates as compared with a 45-minute TIDI; the additional incentive is incongruous with the additional time commitment and perceived effort. Lastly, we see that participation rates meet the 75% threshold at the average FMV for quantitative studies but not for qualitative studies.
Discussion
The results of this research are very consistent with the physician FMV research. Expectations for incentives are substantially different between qualitative and quantitative studies; however, current FMV rates are incongruous with this expectation. While non-physician roles are receiving a higher incentive for qualitative studies, the current rate does not maintain the same level of participation as with quantitative studies. For example, a 40-minute quant survey has an average 77% willingness to participate while a 45-minute TIDI has an average 59% willingness to participate – that’s with five minutes extra time and an increased average incentive of $14. The perceived effort and commitment required to participate in a quantitative study is different than that of a qualitative study. FMV rates for qualitative research should be adjusted to optimize participation rates. Importantly, this tells us that a one-size-fits-all approach (one hourly rate for compensation) does not work; so, while we didn’t observe large differences for quantitative studies we shouldn’t assume that factors like incidence, quota size vs. population size of the specialty, role usage demand and list requirements won’t affect participation in quantitative studies at average FMV rates.
Although in the physician wave of this research we did not see differences based on years of experience or survey participation, we did see important differences among the non-physician respondent types. If you are seeking respondents more experienced in their role, those with 20+ years require, on average, a 14% higher incentive amount. Those who participate in market research more frequently (three or more studies over the past 30 days) require, on average, a 14% higher incentive than those who have participated in no studies. Depending on what you are seeking among your sample mix, these may be important considerations for setting your incentive level.
Further, when evaluating the 75% participation rate, it is critical to consider that our results are amongst a convenience sample from an online research panel. Similar to our physician research, a key question remains: Is a 75% participation rate the right level of participation to try to achieve? These individuals are already predisposed to participating in market research. We should ask ourselves whether we would achieve this same result in a truly random sample. We hypothesize that participation rates would be lower and therefore may not meet the 75% participation threshold and strongly recommend that manufacturers who have one hourly rate for all methodologies reconsider their FMV guidance.
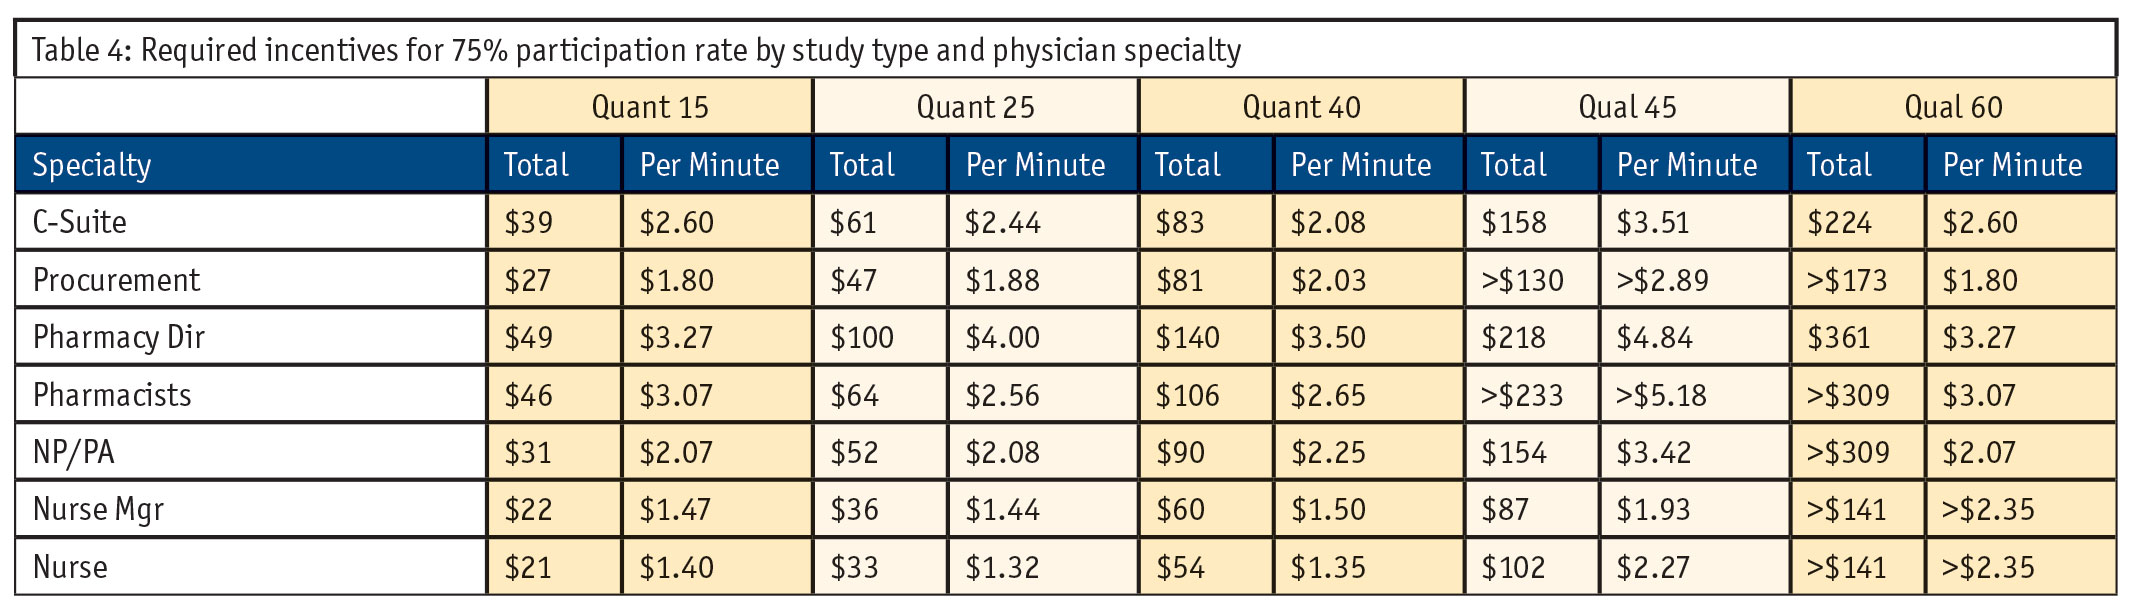
Even with these limitations, there is opportunity to leverage these results as guidance in determining your FMV strategy. Participation rates cannot be ignored and we must recognize that participation is greatly impacted for qualitative studies given the increased effort required for participation. Our research provides per-minute incentive guidance for our targeted roles by survey type as a practical guideline to achieve 75% participation levels (Table 4).
Continue to present a challenge
Until we align as an industry on an approach to determining FMV and what an acceptable participation rate is for market research, it will continue to present a challenge to market research execution. Inadequate incentive amounts lead to potentially biased data, longer fielding times and hesitance from sample vendors to engage in partnerships. This research was conducted to gain a better understanding of the impact these rates have on non-physicians’ willingness to participate in market research studies and to provide guidance on FMV rates moving forward. In addition to greater flexibility when determining FMV rates to accommodate study complexity and engagement factors, we need to be aware of the varying expectations between qualitative and quantitative studies and stay vigilant of an FMV rate that will guarantee at least a 75% participation rate amongst our target population. A one-size-fits-all FMV rate is not an acceptable strategy to uphold the integrity of our insights and ensure that our most valuable resource, physician and non-physician health care workers, continue to provide their valuable input.