Trish Doran is director, consumer insights, at JP Morgan Chase. Shellie Yule is vice president at San Francisco research firm Socratic Technologies Inc.
Surveys remain the No. 1 source of data for market researchers. But over the past 20 years, response rates, respondents satisfaction and data quality have seen continued steady decline. There are many contributors to waning response rates, from busy lives to social media to researchers not keeping pace with the interactivity now readily available through advanced technologies.
Surveys are generally boring (say this to an audience of market researchers and the unease is palpable) and most are still conducted through basic interfaces with little or no use of engaging graphics or other interactive elements. With more respondents straightlining and less differentiation across attribute ratings, data quality is increasingly at risk.
Change is needed but a change to what? For the last decade, gamification has been looked to as the solution; however, the implementation of game-enhanced surveys has been choppy at best and there’s a lingering knowledge void around its effectiveness. This is partly because there are many ways to gamify but there isn’t a clear roadmap to which methods are superior. For example, it’s known that earning badges, scoring points and accumulating in-survey “rewards” may offer a better user experience than plain text with radio buttons but this may put respondents in a gaming mind-set and can lead to a focus on winning rather than providing accurate results. Then there’s the immersive approach, called context gamification, which turns the entire survey into a video game. While that can be engaging, it tends to overwhelm the research.
The sweet spot seems to be an approach called functionally visual gamification, which is loosely defined as a mix of game elements that inject fun (yes, fun) into the survey, meaningfully increase subject matter comprehension, mitigate fatigue and do not threaten research objectives.
Previous research published by academic research gurus and Socratic Technologies has indicated that interactive and engaging surveys keep respondents engaged longer, lead to greater respondent satisfaction with the survey process, instill the feeling that “this activity was worth my time” and measurably increase future survey participation rates. But what else could be gained by creating a thoughtful and engaging survey-taking experience?
Increase engagement
We set out to determine whether game-enhanced elements in a survey could increase engagement; whether interactive elements would heighten the user experience as reflected in self-reported satisfaction and how, if at all, they would impact data quality.
Our hypothesis is that the engaged version of the survey will result in higher levels of self-reported satisfaction and better data quality.
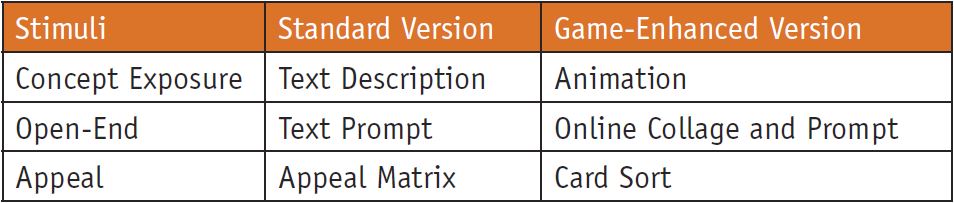
We conducted an online study and presented our findings at the Market Research Event in October 2014. In the experimental design, one set of respondents went through a standard version of the survey, while the other set went through a game-enhanced version of the same survey. The survey comprised three distinct sections and in each one, the game-enhanced version included an interactive element.

To measure self-reported satisfaction, at the end of each section of the survey, respondents were asked the following questions (scaled response, agree/disagree):
- This section of the survey was interesting to me
- The questions asked in this section were easy to understand
- This section of the survey was fun to complete
For data quality, we established a range of metrics, including: straightlining and responses to red herring questions; comprehension; and word count and quality of open-end responses.
A sample of N=1,100 respondents were equally divided and randomly assigned into two cells and the sample was balanced to ensure comparable demographic distribution. Screening requirements were as follows: age 18+; no sensitive industries; primary or shared responsibility for decisions in household; annual household income greater than $25,000; and several other qualification criteria for the main topic of the test survey.
Ultimately, the goal of our experiment was to understand if gamified elements have an impact on respondent satisfaction and data quality.
The answer, in short, is yes.
Adequately describe
One of the challenges with concept testing is the ability to adequately describe the product/service being tested so that consumers are able to offer an authentic assessment of their interest. When respondents are exposed to a complicated concept using only text, we tend to see more “don’t know” responses, which may be indicative of indifference or, more likely, a lack of comprehension. This section of the survey was designed to test the impact of a game-enhanced element (an animation) on data quality, measured by definitive responses to call-to-action and comprehension questions, and respondent satisfaction.
Respondents in both groups were exposed to a complicated financial instrument – an exchange traded fund (ETF). In the standard survey, respondents read through the text description. In the game-enhanced version, they were shown an animation in which the same text was used but images brought the description to life (Figure 1).
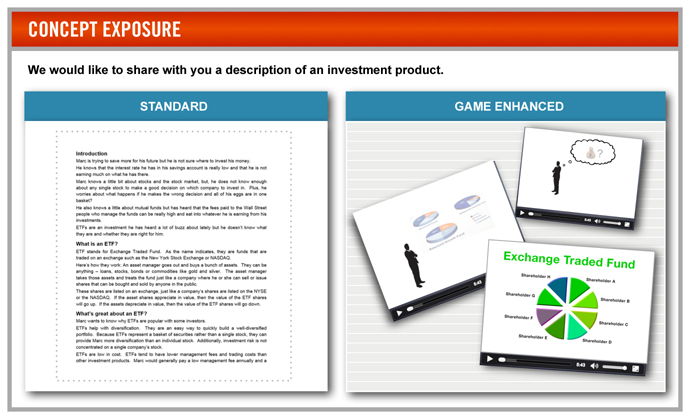
After seeing the text description or the animation about ETFs, respondents were then asked a series of questions about their understanding of and interest in ETFs.
The differences between the two groups were significant. In the game-enhanced group, answers on call-to-action questions, such as seeking more information or consideration, were more concrete and the number of equivocal responses was significantly lower.
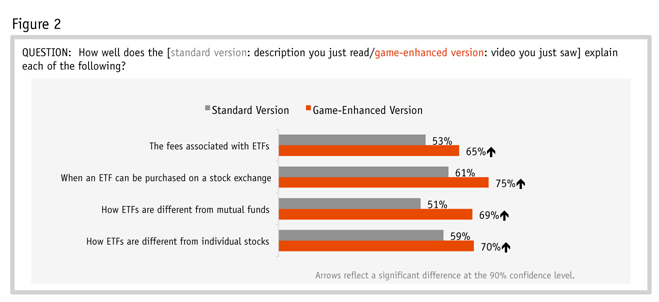
Additionally, game-enhanced respondents showed a significantly higher comprehension of ETFs. The game-enhanced respondents displayed a better understanding of key aspects of ETFs that were part of the concept exposure, such as when ETFs can be purchased and how ETFs differ from stocks (see Figure 2).
On the self-reported satisfaction metrics, significantly more of the respondents who went through the game-enhanced version said the section was interesting, easy to understand and fun to complete. That more of the game-enhanced respondents rated this as “fun” is even more notable given the extra time it took for them to watch the animation, compared to reading (or merely skimming) the text-based description. They gave us more of their time and enjoyed it more.
Beyond a cursory response
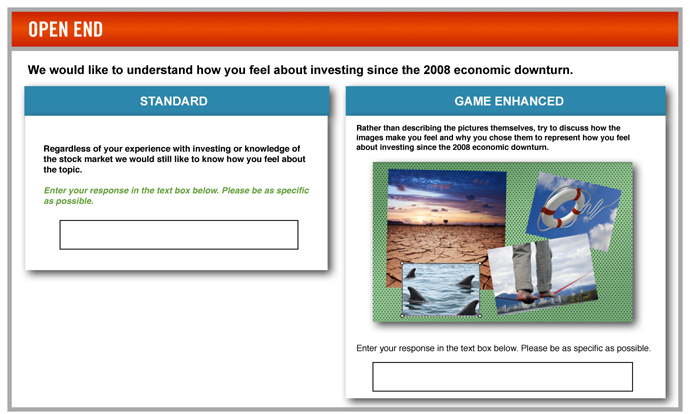
An ongoing challenge with online research is enticing respondents to give anything beyond a cursory response to an open-ended question. When reviewing verbatims, it is not uncommon to encounter (disappointingly) short answers.
Respondents in the standard group were asked to describe their feelings about investing in the post-recession economic climate. In the game-enhanced version, we used an interactive collage exercise (Figure 3). Collage-building is a traditional in-person qualitative technique that is used to help engage participants and reveal deeper sentiments about the topic at hand and this approach translates nicely to an online setting. The game-enhanced group was asked to create a collage of images that represented their feelings about post-recession investing, and then to write about their collage.
Again, we saw significant differences between the two groups. Those who went through the standard version of the survey provided an average of 16 words, while those who went through the game-enhanced version averaged 44 percent more words! Equally, if not more important, the qualitative differences between the two groups were also notable – the collage descriptions provided a much richer narrative.
Sample verbatim response from standard version: “I am more cautious in investing and worry about interest rates being so low.”
Sample verbatim response from the collage-builder approach: “I am too scared after the 2008 downturn to invest my money. I feel like I already have a small amount of money to start with hence my empty pockets selection, that I would be taking a gamble if I did invest because what would happen? I feel like I’d look like the guy in the picture and need to be thrown a lifeline and the monkey’s face represents how I would feel losing money.”
For the self-reported metrics, the game-enhanced version was significantly higher on the “fun” metric. Again, the game-enhanced version took longer and was still rated as more enjoyable.
Rate the appeal
In a section using a drag-and-drop module, we told respondents that a credit card company is creating a new design for the appearance of their cards and wanted to understand which images would be most appealing. For each card image, we asked them to rate the appeal of the card images.
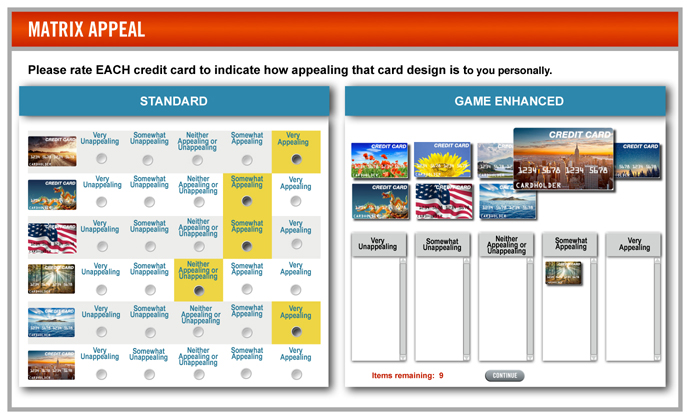
As shown in Figure 4, in the standard version, the card image was on the left side of the screen and a rating scale was on the right side. For the game-enhanced version, we used a drag-and-drop instead of a simple scaled question. With this approach, respondents dragged images into “rating buckets.”
We did not find any differences in the self-reported metrics. Both sections were rated equally on ease of understanding, interest and “fun to complete.”
Considering both approaches side by side, one possible explanation may to be that drag-and-drop has been around for many years, so familiarity has lessened its impact on the respondent experience. This supports the idea that gaming tools should be thoughtfully chosen for relevance to have optimal impact.
Additional time
One of the very real considerations when adding game-enhanced elements to a survey is the additional time that they require, which can be challenging given the struggle to balance extracting the most from a survey opportunity while managing respondent burden. One of the most compelling findings from this research is around how the game elements impact respondents’ perception of time (Figure 5).
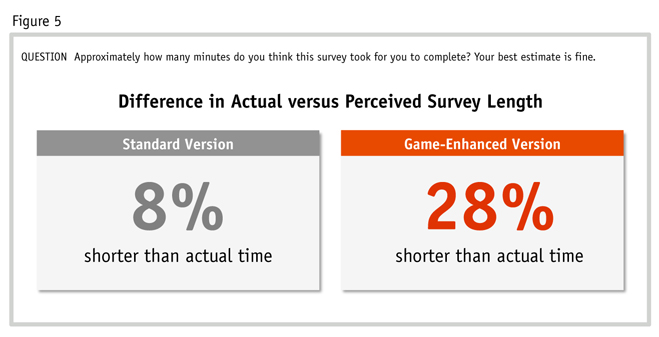
Respondents who took the standard version of the survey perceived the survey as taking slightly less time than it did (about 8 percent less). But the game-enhanced group perceived having spent 28 percent less time completing the survey than they actually did. Perhaps this is corollary on the “Time flies when you’re having fun” axiom but it represents a very real opportunity on which market researchers can capitalize.
We also looked at what, if any, impact game-enhanced elements had on different types of survey takers, specifically people who take surveys infrequently compared to those who frequently participate. It’s worth noting that across the board, infrequent survey-takers were far more enamored of the game-enhanced version than the standard version. This has immense implications for surveying client sample, who are likely to be infrequent survey-takers.
Results are clear
We set out to test the impact of game-enhanced elements on respondent experiences and data quality. The results are clear: game-enhanced design improves the respondent experience and can positively impact data quality. We also discovered that less-frequent survey takers are especially delighted by game-enhanced elements and that game-enhancements reduce the perceived survey burden with perceived shorter survey length. We do recognize that adding gaming elements could affect benchmarks but the benefit will far outweigh this short-term burden.
However, we do see gamification as a toolbox of techniques and we need to choose each technique appropriately.
Here are the guidelines from our research:
• Comprehension of complex concepts and overall data quality can be higher when using game-enhanced techniques. Having better-informed respondents leads to better data quality which leads to better business decisions.
• Gamification exercises need to be used appropriately. Game elements can be used on individual questions, challenging respondents to think creatively and spend time constructing insightful responses; however, the game should not overwhelm the goals.
• While we as an industry should be using gamification tools more frequently, we need to also be considering their efficacy. Drag-and-drop was less effective in producing differences between the survey experiences but it is also one of the oldest forms of gamification. Keep up with the times!
• Game-enhanced questions can have a stronger impact on those who take surveys infrequently, netting higher levels of comprehension, satisfaction and overall quality of data from the group whose feedback we often need the most – the less-frequent survey-takers (e.g., customers!).
• Gamification techniques can re-engage respondents, help reignite interest and counteract survey fatigue.
Furthermore, as the rise of technology continues, research platforms will need to keep pace. There seems to be little doubt that surveys will need to be more visual and interactive to keep respondent interest. There are plenty of examples of design cues from outside the industry.
Creating enjoyable survey experiences is beneficial to the entire research ecosystem. Clients and suppliers gain from the improved data quality and richer responses and from respondent willingness to continue to participating in research. If well-designed, game-enhanced surveys became the general rule rather than the exception, everyone involved would benefit.