Editor's note: Bryan Orme is president of Sawtooth Software, Provo, Utah. The author wishes to thank David Lyon, Keith Chrzan and Tom Eagle for their critiques of earlier drafts of this article.
Researchers often are asked to measure the preference or importance of items such as product features, claims, packaging styles or health risks. Popular approaches include rating scales, constant-sum tasks and best-worst scaling (max-diff).
The standard five- and 10-point rating scales are fast and easy but are plagued by low discrimination among items and scale-use bias. With rating scales, a much more important item won’t necessarily get a much larger score. Respondents are tempted to yea-say (positivity bias) and straightline. Different cultural backgrounds can influence the way respondents use the scale. When comparing groups of respondents, many true differences may be obscured due to the messiness and bias in rating scale data.
With constant-sum tasks, respondents are asked to distribute (say) 100 points across multiple items. Many respondents struggle with this task and the results can be noisy and imprecise. Constant-sum tasks are also difficult for respondents to do with more than about 10 items.

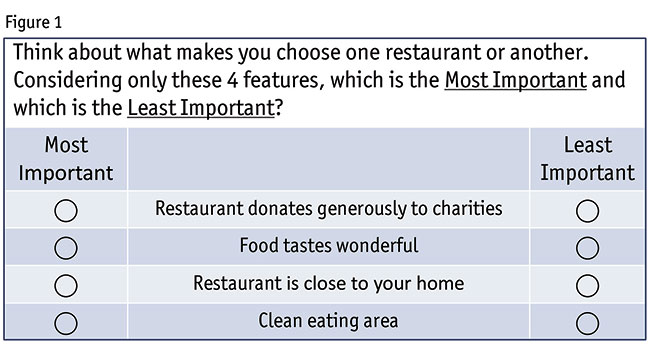
Best-worst scaling (BWS) shows sets of items, typically four or five at a time (Figure 1), asking for each set which item is the best and worst (or most and least important) (Louviere 1991, Finn and Louviere 1992, Louviere et al. 2015). It is typical to show each respondent eight to 15 BWS sets, such that each item appears at least once and preferably two or three times per respondent in a balanced design. Often 20 or more items are included in a BWS study.
BWS scores show greater differences among the items and the results are more predictively accurate of held-out information (Cohen and Orme 2004, Chrzan and Golovashkina 2006). You will find a greater number of statistically significant differences among the items and between the respondents (Cohen and Orme 2004). As a result, with BWS you can use smaller sample sizes and obtain equally good estimates as the competing methods.
The main drawback for BWS is that it can take about triple the time for respondents to do than rating scales. But given the way respondents often rush through ratings grids and tend to yea-say and straightline, having respondents slow down and provide better data seems like a good thing for the conscientious researcher to do.
Might be a much greater difference
We have seen false claims that best-worst scaling data yield nothing more than rank-order information. The argument is as follows: assume respondents use BWS to evaluate items that have an established preference order. In each set, if respondents pick the true best and worst items without error there is no way to learn that there might be a much greater difference in metric preference score between the first and second vs. the second and third items, etc.
The fallacy in the above narrative is the false assertion that respondents answer like robots, mechanically selecting the true best and worst items in each BWS set. Researchers typically study complicated constructs such as importance or preference and humans don’t have a fixed list of scores that they somehow pull out of their brains to reference as they answer BWS questions. Their answers are subject to inconsistencies (errors). Imagine Objects A and B are clearly different for a respondent but Objects C and D are extremely close. It’s likely that each time the respondent compares A and B in a set, she picks A over B. But, that same respondent might not be consistent over multiple sets regarding the order of C and D because of how nearly identical they are in her mind.
Using robotic respondents programmed to act like imperfect humans (let’s call them artificial respondents), we can demonstrate that BWS can capture more than just rank-order scaled preferences: it can accurately recover the relative metric differences among the items. Consider a nine-item BWS study where the true utilities follow non-equal step sizes (Table 1).
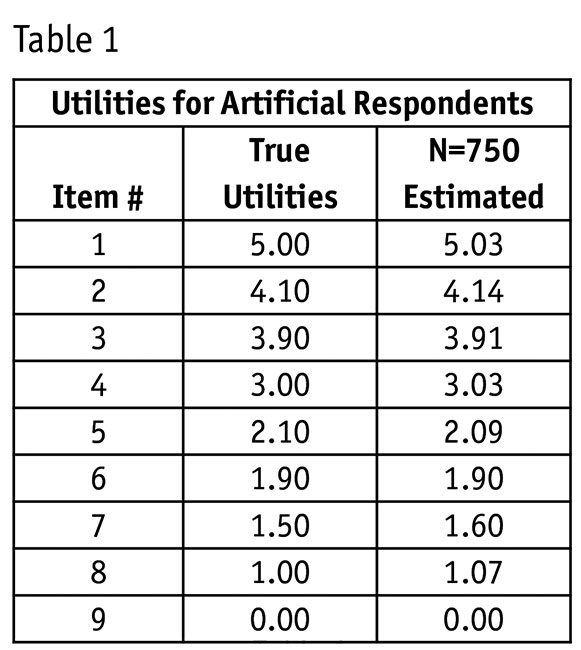
We generated a BWS questionnaire and programmed human-imitating bots to answer according to the true utilities in Table 1, subject to the typical level of response error expected from humans with distributional properties consistent with logit estimation. In Table 1, we also show the estimated scores for these 750 artificial respondents and they very closely fit the irregular utility intervals between adjacent items in this study. BWS has yielded metric information beyond just rank-order scaling. Given enough artificial respondent bots, we can make the estimated utilities perfectly match the true utilities to as many decimal places of precision as desired.
But can we demonstrate that BWS captures relative metric information with real respondents? We recently conducted a BWS study using 350 respondents from Amazon’s Mechanical Turk panel sample. The challenge was to select items with a known quantity metric so that there was an absolute truth to validate against, so we decided to use the population of nine European countries. As a training task, we first showed respondents the nine countries with their populations (in alphabetical order). Following the training task, we asked respondents a few tangential questions regarding which of the nine countries they had visited before and which countries would be best to visit in summer or winter.
Next came the main focus of the study. We asked respondents to rate the nine countries based on relative population size using a 10-point rating scale (endpoints labeled 1 = “less population,” 10 = “more population”), a 100-point constant sum scale, and using BWS (seven sets of four items each). Respondents completed all three exercises and we randomized the order to control for order bias. In the BWS exercise (labeled “most population,” “least population”), respondents saw each country at least three times. We averaged the scores across respondents for the three scaling approaches (Table 2).
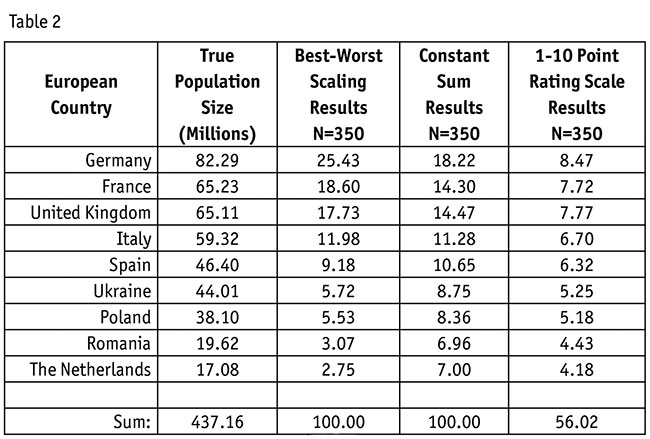
The rank-order recovery for the nine countries’ populations was perfect for BWS and nearly perfect for 1-10 and constant-sum scales. The next thing we noticed is that, true to previous research, BWS led to larger ratio differences among the scores compared to constant-sum and especially 10-point rating scales. The degree of response error affects how much more accentuated the BWS scores become but in every case we’ve compared to the 1-10 rating scale, BWS shows greater differentiation. (We used an exponential transform of the logit estimated utilities to place the BWS results on a ratio scale with a meaningful zero point.)
The largest four countries offered the opportunity to see whether BWS could capture relative metric differences beyond just rank-order information (Figure 2).
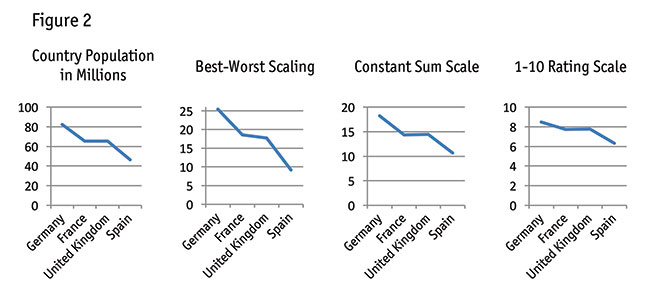
Remember, we reminded respondents regarding the true country populations at the beginning of the questionnaire. France (65.23 million) and the U.K. (65.11 million) have nearly the same population. Germany is larger with 82 million and Spain smaller with 46 million people. How well did the three methods recover the fact that France and the U.K. essentially have the same population?
Referring to Figure 2, BWS appears to be capturing something more than just rank order: it recovers the fact that France and the U.K.’s populations are much closer relative to Germany and Spain, along with directionally showing that France has slightly larger population than the U.K.
Looking just at average scores across a sample can cover up a lot of ugliness happening at the individual level. Those individual-level problems can be especially detrimental when classifying, clustering or segmenting respondents and making predictions. As a straightforward individual-level consistency test, we examined whether the average of the scores for the true top three countries, middle three and bottom three were in descending order. If the three summary estimates were in the correct order for a respondent we scored a hit for the respondent, otherwise we scored a miss. BWS (via HB estimation) showed 80 percent individual-level consistency, the 10-point rating scale had 65 percent and the constant-sum scaling showed 62 percent consistency. HB’s ability to “borrow” data across the sample probably is cheating for this individual-level validation, so we reestimated the BWS utilities without any data-borrowing via purely individual-level logit estimation and found that the BWS consistency score was still superior at 72 percent (p<0.01).
This advantage in terms of individual-level consistency (Figure 3) helps explain BWS’s superiority for classification, clustering and prediction relative to the rating scale methods.
We recognize that our experiment focused on the ability of respondents to recall factual information rather than their ability to express preference or importance. There are psychological differences, for certain. Given that we have already conducted and seen multiple comparative studies among these methods on preference/importance scales, we thought it would add to the discussion to conduct this research involving memory recall of objects with known and true metric measures.
Some known preference
Best-worst scaling involves just comparative judgments. We don’t learn whether respondents like or dislike the items in any absolute sense. One solution is to include an item in your study that has some known preference, monetary value or importance. You can then compare the score for the known item to the other items in the experiment. Another solution is anchored BWS: adding a few questions to a BWS study to establish a meaningful anchor point, such as buy/no buy, like/dislike or important/not important.
We applied anchored BWS to the evaluation of European country sizes. After we asked the BWS questions, we computed the scores for each individual on the fly. We ranked the countries from first to ninth based on each respondent’s scores and asked respondents whether certain countries had more or less than 50 million people. Rather than ask for all nine countries, we shortened the task by asking about only the first-, third-, sixth- and ninth-place countries in terms of the respondent’s individualized ordering.
After reestimating the model with the addition of the anchoring information, the new BWS scores now were scaled relative to an anchoring point of 50 million in population, with the anchor located correctly between Italy (59 million) and Spain (46 million people).
An exceptional tool
With or without the optional anchoring step, best-worst scaling yields more than just rankings. Using both robotic and real respondents, we’ve shown that it recovers relative metric differences among items. If obtaining discriminating measurement of preference and importance is critical to you, if you want to avoid scale use bias and if you want to improve your market segmentation and predictions, then BWS is for you. It is a truly an exceptional tool in the researcher’s toolbox.
References
Chrzan, Keith and Natalia Golovashkina (2006). “An empirical test of six stated importance measures.” International Journal of Market Research, 48, 717-40.
Cohen, Steve and Bryan Orme (2004). “What’s your preference?” Marketing Research, Summer, American Marketing Association.
Finn, A. and J.J. Louviere (1992). “Determining the appropriate response to evidence of public concern: The case of food safety.” Journal of Public Policy and Marketing, 11, 1, 12-25.
Louviere, Jordan J. (1991). “Best-worst scaling: A model for the largest difference judgments.” Working paper. University of Alberta.
Louviere, Jordan J., Terry N. Flynn, and A. A. J. Marley (2015). Best-Worst Scaling: Theory, Methods and Applications. Cambridge University Press.