Editor’s note: Jennifer Sikora is the vice president of marketing at CivicScience, a Pittsburgh research firm.
Most consumer marketing and insights research teams have been increasing their social media attention year over year – not just in terms of marketing and advertising dollars but in analyzing data gathered from social media to help inform business decisions. That attention is more warranted now than ever: our recent data show that the influence of social media on consumption decisions has grown 10 percent in 12 months.
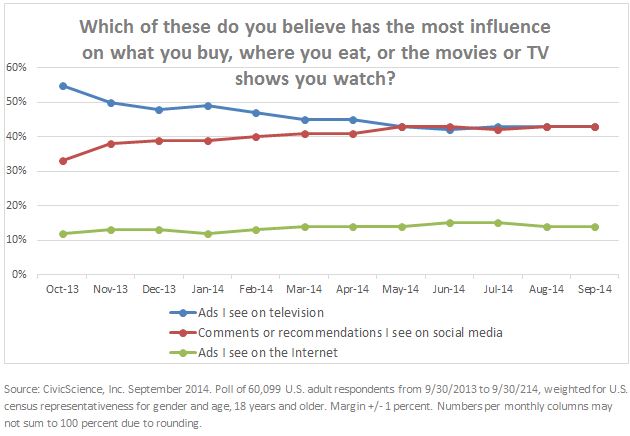
The data reveal that U.S. adult consumers in aggregate report in equal numbers that TV ads and social media chatter influence them “the most” (as of August 2014 and September 2014), with each influencer category capturing 43 percent of respondents. Compare this to a 22-point difference in October 2013, when 55 percent of consumers said TV ads were most influential and 33 percent said social media chatter. The big loser was television advertising, which dropped 12 percent in influence in those 12 months. Internet ad influence rose slightly from 12 percent to 14 percent over the same time period. (An overview of the Web-based data collection methodology is provided at the end of this article.)

A variety of potential factors could explain this trend line, given that neither the overall profile of respondents nor the collection methodology changed over those 12 months. Consumers may be getting more comfortable over time to admitting that the comments and content they see from their social media connections have some influence on them, while conversely, they may be less willing to admit that obvious paid ads have persuasive powers.
Regardless, it is clear that consumer sentiment related to social media and vehicles for advertising may see marked changes in ever-shorter periods of time, which should be closely monitored. Further, segmenting consumers with greater frequency based on what’s most influential has the potential to provide exceptional intelligence for use in strategic and tactical business planning.
By mining the data from those 60,099 anonymous U.S. adult respondents who engaged with this research question, we were able to generate a more in-depth analysis of custom-defined consumer segments based on what influence option they selected. Based on those segments, our study analyzed hundreds of other possible questions these same respondents answered over time, to find the strongest correlations among these three groups. The following table summarizes personas for each of the three segments, based on characteristics more likely to be seen in the data when compared to the other segments:

Generally speaking, among those most influenced by TV ads, we see an older and more traditional audience. They tend to watch more TV and to watch it live, rely on telephone communication, shop mostly in stores and drive American-made cars.
Those most influenced by Internet ads overall are younger (18-29), somewhat more likely to be male and prefer to engage with things via the Web: more of their TV viewing and shopping is done online. They have more techie tendencies, such as video gaming and following tech news closely. They also have healthier dietary behaviors and are more likely to fall into the lowest and highest income groups.
Those most influenced by social media chatter are in aggregate younger (18-29) but somewhat more likely to be female. They prefer consuming TV using their DVRs and they are very hooked on their smartphones, digital devices and related behaviors.
Let’s look more closely at some of the attributes:
TV viewing: No huge surprise is that those who are most influenced by TV ads tend to watch more hours of TV each day – in fact, they’re almost two times more likely to watch four plus hours per day compared to those most influenced by Internet ads. Those influenced the most by Internet ads watch the least amount of TV on a daily basis.
When asked about the primary way they watch TV, respondents who said they favor “live” TV are 57 percent more likely to say they’re most influenced by TV ads vs. social media chatter. DVR viewers are 27 percent more likely to be influenced by social media chatter vs. TV ads. Those who most often view TV via online streaming are 244 percent more likely to say their consumption choices are influenced the most by Internet ads or social media chatter as opposed to TV ads.
Video gamers: Daily video game players are more likely to say that Internet ads influence them the most, they are 39 percent more likely to pick this option over social media chatter and 121 percent more likely over TV ads.
Digital device usage: Those who say “yes” and “somewhat” to having digital device addiction are more likely influenced by social media vs. other influences. For example, those who say “yes” to digital device addiction are 104 percent more likely to say social media vs. TV ads influences their consumption decisions.
Online shopping: Those who say they’re most influenced in consumption decisions by Internet ads do more online shopping than those most influenced by TV ads and slightly more than those influenced by social media chatter.
Diet: Organic food fans – who say they buy organic “every chance I get” – are more likely to be influenced in their consumption decisions by Internet ads: they’re 17 percent more likely to pick this than social media chatter and 93 percent more than TV ads.
Regionally, we find that social media’s influence is higher in cities that include Boston, Mass.; San Francisco, Monterey, Santa Barbara, Los Angeles and San Diego, Calif.; Portland, Ore.; Salt Lake City, Utah; and Austin, Texas.
It’s clear from the data that research teams will be challenged to keep a closer watch on the changing pulse of consumer sentiment related to advertising and social media influence. And as the data reveal, there are distinct segment-based differences to be mined even further – and which can’t be obtained simply through the use of social media monitoring tools that have limited capability to dive in to the “who” question of key trends.
What also will be worth analyzing over time is how and when these segments change, as more consumers find it easy to shift attention to Internet-based content, including TV and movie content, leaving less opportunity to reach them through traditional live TV advertising delivery.
The methodology:
CivicScience collected this data via opt-in, non-incented Web-based polls distributed across hundreds of diverse publisher Web sites. Each month in this study collected a sample size of approximately 5,000-6,000 U.S. adult respondents, depending on the month, for a total of 60,099 from September 30, 2013 to September 30, 2014. Using cookie and data mining technology, CivicScience builds psychographic profiles of these anonymous respondents with each question they answer over time, aggregating demographic, behavioral, sentiment and trending data. The methodology has been scientifically validated by a team of academic leaders and by independent research firms.