Editor's note: Deb Ploskonka is chief data scientist at Cambia Information Group. She can be reached at deb.ploskonka@cambiainfo.com.
An uncomfortable theme is beginning to dominate our industry, at least for those of us who draw sample from online panels.
It’s fraud.
Over time, we have had to shed our naivete around how cheaters cheat and how extensive the problem is. We have learned we must go out of our way with every online project to protect our data, our insights and our clients from falsehoods. The investment we are making to ensure clean data has risen dramatically over time, in proportion to the increasing fraud present, leading to this article.
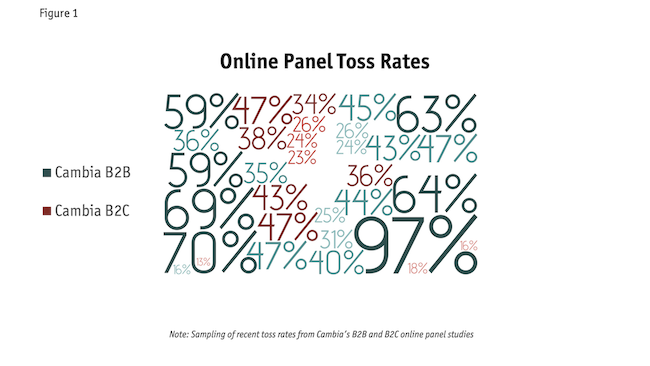
Figure 1 shows a sampling of Cambia’s online panel toss rates over the past five years, for B2B and B2C studies, from almost a dozen panels. Although individual records may look fine in isolation, when we look across respondents, we see patterns of duplication indicating fraud. From these rates, it appears B2B studies are more attractive to fraudsters, likely due to the higher incentives. Additionally, consider what the incidence of fraudsters may be to that of the target audience. If your target audience is extremely narrow, fraudsters who figure out the qualification criteria may fill your quotas faster than genuine respondents.
The degree of fraud has become so pervasive, and the skills of fraudsters so advanced, that it will take all of us to defeat it: sample suppliers, research agencies, software companies, corporate researchers, end clients and industry organizations such as ESOMAR and Insights Association.
Add random noise
Why does it matter? Conventional research industry wisdom has been that lower-quality respondents simply add random noise and cancel each other out, softening the findings but not meaningfully changing them.
Whether true or not in the past, this is certainly not true now. Over and over we at Cambia are seeing similar, non-random patterns of responses among those who are clearly fraudulent, such as: over-selection of multiple-response items; over-selection of anything that might be interpreted as a qualifier, even deep into the survey (e.g., “I own this product”); and higher ratings on scale-based questions.
Indexed results of cheaters vs. good respondents from a recent Cambia B2C study confirmed that cheaters tend to over-select and that their data can meaningfully change survey findings. If including data from these less reliable respondents in reporting, disappointment may follow when the research results fail to align with reality.
With B2B studies, we often see cheaters: claiming they are the CEO (even of a $1B company); claiming they are the sole decision maker; or saying yes to any “yes/no” question that may seem to be a screening question.
Cheaters are experienced at survey-taking and often know what is likely to qualify them for a study, amplified if the question or response options are leading in any way. Any low-incidence study (e.g., IT decision makers, C-suite, physicians) is a particularly rich target due to higher-than-average incentives. Between imperfect targeting by panels and their partners and fake personas created by motivated fraudsters, data collected online must be regarded with suspicion until thoroughly scrubbed to the point of having adequate confidence in what remains.
More effective solutions
Understanding the variety of ways in which our data is now under attack can enable us to develop more effective and comprehensive solutions. This is not a one-time activity, however, as fraudsters are constantly evolving – when one strategy gets identified and blocked, another route is found. There is no single solution for ensuring data quality: it takes a diverse variety of tools, as well as transparent partnership with sample suppliers and security services. Working together is our only hope of success. Our full report on endemic cheating covers our learnings and approaches to combating fraud in depth, including a checklist to use with every project: https://www.cambiainfo.com/dec-download-page/.
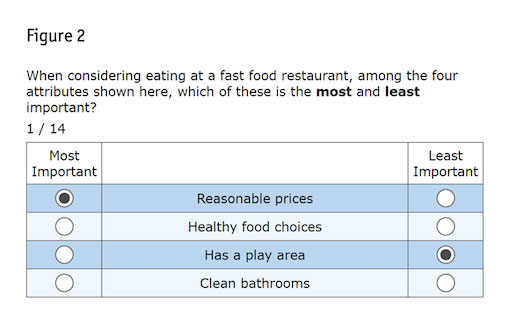
Today we’d like to share a new tool our research uncovered that we have added to our fraud-detection toolbox. If you’re not yet familiar with it, MaxDiff (maximum difference scaling, aka best-worst scaling) is a question type where respondents are shown subsets of items/attributes and are asked to indicate which is the best and which is the worst.
Two of its many advantages are that it yields a rank ordering of the items with ratio-scaling properties and it eliminates any opportunity for scale use bias to play a role in the results.
For a standard MaxDiff, respondents typically see six to 15 MaxDiff questions like the example in Figure 2. For a MaxDiff added solely for the purpose of catching cheaters and not as part of the research objectives, six to 10 would suffice. Items are rotated across the questions such that each item would appear a total of two to four times per respondent.
In preparation for the paper Cambia agreed to write and present at the 2022 Sawtooth Software Conference, Cambia and Sawtooth Software discussed data quality challenges and the ways in which MaxDiff might effectively identify fraudsters. Three approaches were discussed:
- MaxDiff can identify those answering randomly – responses require internal consistency to pass the root likelihood (RLH) check.
- MaxDiff can identify those straightlining on position – given that MaxDiff displays items in random positions, someone choosing the same location each time is not taking the exercise seriously.
- Programs/bots – if not immediately obvious, can be identified by reverse engineering segment assignments on utilities run when data collection is nearing completion.
The first approach has been available for years. The second was generated in recent times by Kenneth Fairchild, when with Sawtooth Software. The third was newly tested by Cambia and first presented at this conference, subsequently leading to a paper, a report and this article. We’ll now apply these approaches to a B2B and a B2C case study.
B2B case study
A client requested a quick-turn online version of an ongoing phone study of low-incidence, niche IT decision makers. Dropping the phone version into an online package led us to omit our standard open-ended questions and bot-catchers.
Overnight, numerous quotas filled (over 80% of the total target). We found:
- Verbatim responses for “exact job title” perfectly matched options from the subsequent question on job role, including capitalization.
- Low-incidence audience went from one out of 30 qualifying to 29 out of 30 qualifying.
- Time stamps showed a new survey taken about every 20 minutes.
- Closed-ended responses were not duplicated across respondents, nor straightlined.
On their own, each individual record looked fine but in context, they were impossible. We immediately raised this to our supplier, who raised it to their security service. The supplier confirmed our study had been attacked by bots, allowing previously blacklisted respondents to enter. An unethical source had exploited a loophole in the security service, manipulating the data within the URL to eliminate quality flags.
The best part about this B2B study was that it included a MaxDiff exercise, which gave us an unexpected opportunity to test our hypothesis. The MaxDiff had 24 items, each seen three times per respondent, with four items per task. The 238 “respondents” that came in overnight were sufficient to run the hierarchical Bayes statistical model and then k-means cluster analysis to place respondents into mutually exclusive groups (segments). Prior to segmentation, the utilities looked ordinary, though undifferentiated, and would not have raised an alert.
The segmentation, however, was outstandingly clear and sharp: 99.7% reproducible for the three-segment solution.
Visually inspecting the mean utility per item per segment, it quickly became clear the bot had been run with three programs, or strategies, for the MaxDiff, resulting in these three segments:
Segment A: Longest attributes were chosen as most important; shortest attributes as least important. Correlation across the 24 items of the rank order of the length of the item with the mean utility score for that segment was +0.95, highly significant.
Segment B: Items were selected randomly. Sawtooth Software’s suggested RLH cutoff of 0.336, designed to catch 80%, would indeed not have caught all of these. However, raising the cutoff to 0.396 would have captured them all but would also have captured 15% of Segments A and C.
Segment C: Shortest attributes were chosen as most important; longest attributes as least important. Correlation as in Segment A was now negative, at -0.90, highly significant.
By using multiple strategies, the bot disguised, at least initially, that it was a bot. Had there been only one approach, it would have been immediately obvious upon inspection of the data without segmentation.
As a result, whenever you have a MaxDiff study, we highly recommend running a segmentation on the resulting utilities regardless of whether it is part of the study’s objectives. If there are highly reproducible segments, see if you can reverse-engineer what was done, realizing that the rule next time might be the number of letter e’s in the attribute. Fraudsters adapt quickly. If you find bots, or any other repeated issue, please tell your supplier.
When you have a study without a MaxDiff, see if a short, simple one (e.g., 10 items) can be added to potentially catch cheaters. Ideally also include an actual bot checker such as reCAPTCHA if your panel provider is not already doing so.
B2C case study
Cambia conducted a B2C test study specifically to test MaxDiff’s effectiveness in catching cheaters. We partnered with Symmetric, a long-time data quality advocate and sample provider, to source a variety of online panels for the test. Informed by our B2B experience, the 11 MaxDiff attributes, seen three times, in groups of four, were each of differing lengths.
We analyzed the data by looking at the various data-check flags enabled, divided into three categories: panel pre-screening, in-survey penalties and post-survey analysis. We identified and named five types of fraudulent respondents:
1. Hackers are digitally identified prior to entering the survey via automated digital methods such as device fingerprint duplication.
2. Bots are programs developed to complete large volumes of survey to rack up rewards and can be observed in the data by visual inspection.
3. Con Artists are humans taking surveys purely to rack up rewards and are most easily identified through open-end responses.
4. Slackers (aka satisficers), the more familiar type who have always been in survey data, can be addressed with in-survey checks such as red herrings and trap questions.
5. Pros are people who possibly make a living taking surveys, in some cases attempting 80 a day or more.
These categories are further described in our report at www.cambiainfo.com/dec-download-page, along with approaches to deter them.
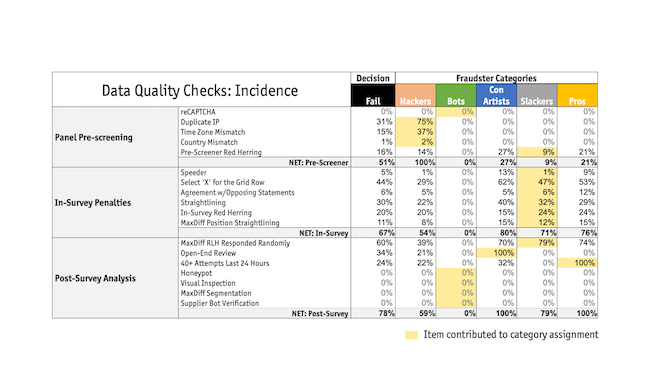
Figure 3 shows the numerous ways in which we flagged potential bad respondents. Highlighted are the items contributing to each category assignment. Pros and Con Artists share qualities with Slackers, except for number of surveys and bad open-ends, respectively. All three of these categories responded randomly to the MaxDiff at least 70% of the time, while Hackers responded randomly 39% of the time.
Another way to look at the data-cleaning process for this study is what would have happened had we turned away or terminated potential respondents as soon as we had information showing we wouldn’t want to keep them. Had we turned on the pre-survey tools available through Symmetric, 26% would have been prevented from entering (Hackers + pre-screener red herring failures). Of those remaining, 17% (Slackers) would have been caught during the survey if we had automatically terminated those with two or more in-survey penalty strikes. Of those remaining, we would have tossed only 8% for having poor open-ended responses (in our experience, this figure is often much higher, especially for B2B). Given the short, engaging, high-incidence survey, we hypothesize our chances of having genuine respondents complete the survey were much higher.
And lastly, 13% of the final group would have been tossed for having a low RLH, indicating they had responded to the MaxDiff randomly. Had we used MaxDiff as the only tool for identifying cheaters, 62% of the 503 tossed would have been caught (60% for low RLH, an additional 2% for straightlining) – pretty effective!
Hypothesis was confirmed
Our hypothesis that MaxDiff could effectively catch many cheaters was confirmed, as in both case studies, it caught the majority. We therefore recommend including a MaxDiff wherever possible. Other reasons to include one could be to assess attitudes, usage or behaviors. Whenever you have a MaxDiff, run segmentation and examine the results. A follow-up question may also be included as questionnaire space allows, e.g., “Which of these is the most important to you?” to help validate the MaxDiff findings.
Fraudsters are continually evolving their approaches and so we must do the same. While humans will continue to be required to manually review data for fraud, you can reduce the amount of time (labor) spent by incorporating as many quantitative and automated approaches as possible.