Editor's note: Keith Brady is vice president at Socratic Technologies Inc., a San Francisco research firm.
We all know that the tendency is for researchers to eventually become complacent. Whether a result of increased workload and/or decreased supervision, survey design can suffer. But we must remain vigilant! After all, our live-lihoods depend on provision and analysis of accurate and dependable data.
So how does a market research professional employ data collection procedures and methodologies in a manner that eliminates error and ensures accurate measurement of population characteristics? The goal of re-searchers is to design methods that minimize and/or eliminate error but the conundrum exists that, even if suc-cessful, there would be no way of truly knowing, as gathering a statistical measure of response bias or evidence of its elimination is costly and often unrealistic.
That’s why careful survey design and response predictions are so important, so consider this a refresher!

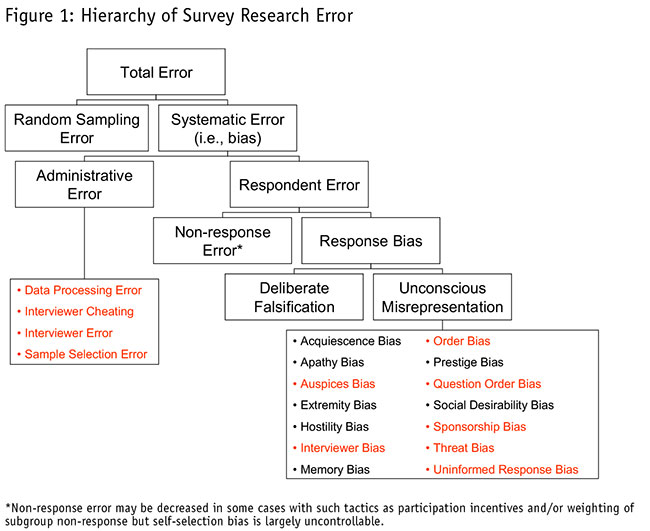
Figure 1 shows the hierarchy of survey research error, with those influencers highlighted in red that can be controlled and prevented at least to some degree with proper survey design and data collection procedures.
Administrative error is perhaps the most easily circumvented. Data processing error can be avoided with careful quality control and proofing procedures. Alleviation of sample selection error requires: 1) a careful look at survey distribution channels to ensure consistency1 across sociodemographic and psychographic profiles and 2) subsequent weighting of responses according to those profiles. The simplest method for avoiding interviewer error and interviewer cheating is, if possible, to employ survey distribution methods that do not require an inter-viewer (Web-based survey, written survey, etc.). If such methods are not possible, development of and adher-ence to a detailed script are encouraged.
Here are 10 tips for reducing unconscious misrepresentation.
1. Assure respondents of anonymity. This helps to improve response rates (easing non-response error) and eliminate potential threat bias. This is particularly important for surveys of subordinate groups (e.g., employ-ees, suppliers, students, etc.).
2. Avoid revealing the purpose of the research or the organization conducting the study. This works to pre-vent sponsorship bias and auspices bias. This is especially applicable to survey research conducted by polit-ical groups.
3. Design a survey that is concise, interesting, and simple to complete. This ensures higher response rates, reduces survey termination and eases uninformed response bias. Well-designed questionnaires include clear and concise instructions on how they should be completed. These must be very easy to understand, so use short sentences and basic vocabulary. One way to eliminate misinterpretation is to emphasize crucial words in each item by using bold, italics or underlining. The look of the survey is also important – use professional production methods for the questionnaire (computerized/desktop production tools).
4. Carefully order the questions of the survey. This helps to reduce question-order bias and affects response rate and captured beliefs. Items on a questionnaire should be grouped into logically coherent sections, with the most important metrics appearing in the first half of the questionnaire (to increase the chances that those re-sponses are collected in partially-completed surveys). Most studies have found that the order of questions can affect the manner of response, with questions in the latter half of a questionnaire receiving fewer and less ex-treme responses. When specific questions/ratings are asked before general questions/ratings, respondents tend to exhibit greater interest in the general questions, though they tend to base their answers on details or at-tributes presented in the survey itself rather than pre-existing beliefs. The decision to order questions from general to specific or specific to general should be based on whether the purpose of the data collection is to capture top-of-mind opinion or informed response on key measures. The other way question order can affect results is habituation, which occurs when a series of questions all have the same answer choices. Respondents are more likely to repeat answers without due consideration.
5. Provide a “don’t know, no opinion or not applicable” option where possible. This reduces uninformed response bias.
6. Use reverse-scaled ratings when possible. This removes bias related to psychological interpretation of rat-ings. When using a Likert or other psychometric scale, reverse-scoring will invert the numeric scale for half of the distributed surveys. This strategy allows a balanced collection of data, though introduces a greater capaci-ty for data processing error as reversed scores require normalization before analysis. A similar variant involves the restatement of questions in some surveys to the negative (e.g., changing “My workplace encourages inno-vation” to “My workplace stifles innovation”).
7. Avoid ambiguous or emotionally-charged words and phrases. This helps to eliminate subjective or reac-tionary responses (e.g., “Do you believe that hunting is an especially cruel form of murder?”).
8. Avoid suggestions, implications or justifications in the questions. This helps to avoid subconscious in-fluence of the respondent. Leading questions are phrased in a manner that forces or encourages a specific answer or opinion from the respondent (e.g., “Research has shown that children should eat at least four serv-ings of vegetables per day. How many servings does your child eat per day?”). Biased questions can result in skewed results, so objective phrasing is encouraged.
9. Use counter-biasing statements with sensitive questions. This provides reassurance for respondents who may be embarrassed or hesitant to provide an accurate response (e.g., “Studies have shown that every year, more men are visiting professional hair salons in lieu of barber shops. Have you visited a professional hair sa-lon in the past 12 months?”). This helps to reduce bias, non-response error and/or survey termination.
10. Randomize response choice order. This helps eliminate order bias. Naturally, this does not apply to rat-ing scales and “Other” and “N/A” options should consistently appear throughout the survey at the begin-ning/end of the choices.
Here is a glossary of terms associated with the survey process:
Acquiescence bias – statistical error in the responses of subjects caused by some respondents’ tendency to agree with all questions or to concur with a particular position; the “yes effect.”
Administrative error – results are unrepresentative due to human/process errors, independent of survey con-tent.
Apathy bias – statistical error in the responses of subjects caused by some respondents’ lack of emotion, motivation or enthusiasm.
Auspices bias – statistical error in the responses of subjects caused by the respondents being influenced by the organization conducting the study (e.g., sales rep for a pharmaceuticals company completes a survey related to the effectiveness of one of the company’s new drugs).
Bias – statistical sampling or testing error caused by systematically favoring some outcomes over others.
Data processing error – results are misrepresented (e.g., opposite scaling) or findings are miscalculated; programming error.
Extremity bias – statistical error in the responses of subjects caused by some respondents’ tendency to use extremes when responding to questions. The opposite phenomenon, whereby respondents temper their extreme opinions, is called central tendency bias.
Habituation – the tendency of some respondents to repeat answers when a series of consecu-tive questions have the same answer choices/rating scale.
Hostility bias – statistical error in the responses of subjects caused by aggression (e.g., disgruntled former employee is asked to rate a product manufactured by the company for which they used to work).
Interviewer bias – statistical error in the responses of subjects caused by the presence of the interviewer during the survey (e.g., respondent is interviewed on the subject of racial perceptions by a member of another race).
Interviewer cheating – survey answers or respondent details are deliberately misreported or fabricated by survey practitioner.
Interviewer error – survey answers or respondent details are accidentally misreported by survey practitioner; field error.
Memory bias – statistical error in the responses of subjects caused by enhanced or impaired recall or the alteration of what the respondent remembers (e.g., respondent is asked to rate the facilities of a resort she visited on a trip where she contracted malaria).
Non-response error – occurs when the survey fails to get a response to one, or possibly all, of the ques-tions, resulting in respondent results that are not representative of the true value of the population parameter. Self-response bias usually drives non-response error and is affected by factors such as level of in-terest in the subject matter, day/time of survey solicitation, etc.
Order bias – statistical error in the responses of subjects caused by the answer choice order and some respondents’ tendency to select the first (or first few) answers from a list over others.
Prestige bias – statistical error in the responses of subjects caused by some respondents’ desire to appear in a different social role (e.g., What kind of car do you drive? What is the square footage of your house?).
Question order bias – statistical error in the responses of subjects caused by the order of questions in the survey. As stated earlier, studies have found that questions in the latter half a questionnaire receive fewer and less extreme responses.
Random sampling error – a statistical fluctuation that occurs because of change variation in the elements selected for the sample.
Respondent error – a classification of sample bias resulting from respondent action or inaction.
Response bias – a classification of bias that occurs because respondents purposefully or unconsciously give statistically inaccurate answers to survey questions.
Sample selection error – when the results of a sample show a persistent tendency to deviate in one direction from the true value of the population parameter, often arising from non-random sampling; improper sample de-sign or sampling procedure execution (e.g., a survey investigating the affect of price on demand for airline travel is distributed to business travelers but not to leisure travelers, leading to the conclusion that price is not a deter-minant of purchase behavior).
Self-selection bias – a classification of bias that occurs because of the respondents’ decision of whether or not to participate; the “selection effect.” Participants’ decision to participate may be correlated with traits that affect the study, making the participants a non-representative sample (e.g., a farmer is more likely to complete a survey related to composting than an urban resident).
Social desirability bias – statistical error in the responses of subjects caused by respondents’ desire to re-spond in a socially acceptable manner (e.g., “How important to you is the threatened habitat of the spotted owl?”). This can result in over-reporting of socially desirable behavior and under-reporting of socially undesirable behavior, leading to a confounding of the relationships between variables.
Sponsorship bias – statistical error in the response pattern of subjects caused by respondents’ knowledge of the survey’s initiator. Views and opinions are not expressed as freely (often unconsciously) and interviewees may deliberate about appropriate and acceptable answers.
Survey termination – exiting a survey or interview before completion.
Systematic error – results from some imperfect aspect of the research design or from a mistake in the exe-cution of the research.
Threat bias – bias in the responses of subjects caused by fear or concern of the potential consequences re-lated to their responses (e.g., company employee is asked to rate the performance of his manager, so feels compelled to provide a favorable response).
Unconscious misrepresentation – response bias caused by question format, ambiguity or content.
Uninformed response bias – error in the responses of subjects caused by unfamiliarity with subject matter (e.g., respondent who does not drink beer rates the attributes of a particular brand of lager).
REFERENCES
1 Consistency does not necessarily refer to equal weighting of response data across all sociodemographic and psychographic elements but rather to representative weightings of these elements to the general or target populations.