
Context is key
Editor's note: John Goodman is vice chairman, Customer Care Measurement & Consulting, Alexandria, Va.
 I recently worked with three companies that are struggling with how to place surveys within customer insights, continuous improvement and customer experience (CX). In one company, the primary role of the survey function was to measure service transactions with an end-of-year focus on the results of the annual relationship survey. In the second company, while Net Promoter Scores (NPS) were ubiquitous and used in evaluations from the frontline staff to major business unit leaders, little seemed to be getting fixed. In a third company, only three surveys were executed but all resulted in continuous improvement and a positive impact on executive strategy. The key to a positive impact is an organized approach to using surveys appropriately and placing them within the broader voice-of-the-customer (VOC) data context.
The two key phrases for the role of surveys are “appropriate use” and “data context.” In most companies, 90 percent of survey resources allocated to CX (as opposed to market research) are devoted to measuring frontline performance and closing the loop to contact customers who are unhappy with a transaction or service interaction. While both activities do have value, they are not the most cost-effective use of resources. Surveys are a valid source of feedback to service staff but, due to small numbers, often are not an appropriate indicator of performance for individual customer service representatives (CSR). Using surveys for customer win-back activity is certainly noble and productive, but consists of chasing the horse after it has left the barn. A much more cost-effective approach is to fix the barn door; that is, to devote a higher percentage of resources to fixing the entire CX and the tools available to the service staff.
Much of my book, Strategic Customer Service, is devoted to the VOC and its application within an organization.1 The book suggests new objectives for surveys by placing them within a broader VOC context, creating a credible business case and moving to a tailored consulting approach of packaging and delivering results.
At a macro level, there are five types of surveys:
- transaction surveys that measure the outcome of a particular interaction;
- relationship surveys that gain feedback about most or all of the customer journey including key points of pain (POP) and their impact on loyalty and satisfaction;
- competitive surveys that ask current customers about their experience with both the company and its competitors;
- market research surveys that address a person’s willingness to purchase a current or hypothetical product; and
- pulse/public affairs issue surveys that address emerging political or social events.
For a systematic VOC process, only three of the above are relevant: transaction, relationship and competitive surveys. The problem comes from how the surveys are used and their context or lack thereof. Surveys can either be for creating a baseline from which improvement goals are established or for tracking progress toward a previously set goal. The accompanying table illustrates these two broad purposes and how the five types of surveys can be directed.
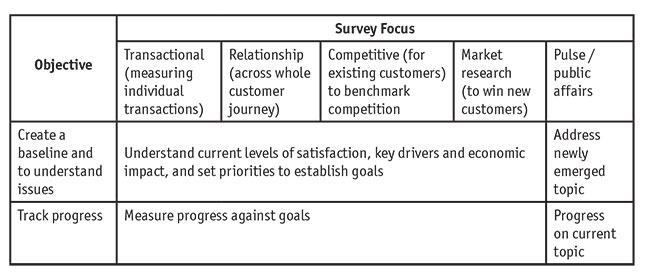
Baseline and tracking surveys can be directed toward a particular transaction, the overall CX or the competitive marketplace. However, the focus for all three of these surveys is the existing customer. Market research surveys primarily explore how to win new customers or, secondarily, sell new products to existing customers.
Two broad objectives
There are two broad objectives for VOC surveys: 1) establish a baseline from which priorities and goals can be set and 2) track progress toward those goals.
Surveys are a very cost-effective way to establish baseline levels of customer satisfaction and loyalty, as well as for comparing company performance to competitors via competitive benchmarking surveys. Customers can be asked about each phase of the relationship, the level of problems, responsiveness to issues and a set of outcome variables including satisfaction, loyalty, word of mouth (WOM) and value for price paid. The problem level and resulting overall satisfaction, loyalty and, if desired, NPS, all indicate baseline levels from which priorities can be set and goals established.
Establishing baseline levels of satisfaction and loyalty
The baseline survey can identify overall satisfaction as well as the underlying problems that damage satisfaction. The survey allows estimation of the damage in loyalty, word of mouth and revenue from not fixing each of the problems. Unfortunately, understanding the “why” of problem occurrence is not so easily derived from surveys. Surveys are not as effective as diagnostic devices. An understanding of the details of a problem, the number of customers actually encountering the problem and the cause are difficult to precisely discern from survey data.
An effective analysis of customer problems depends on the ability to understand the actual number and cause of each POP. The number of problem occurrences and their cause can be clarified by placing the survey results within the context of other data sources. Operational and customer contact data, as well as employee input, is helpful. Operational data can quantify exactly how many customers suffered a service failure. Customer contact data provides complaint volume and underlying customer expectations. Employee input will explain the cause of the process failure.
Benchmarking your company against others. Another type of survey, which is often used in oligopolistic industries, is the benchmark survey where you measure both your company’s performance and the parallel performance of key competitors. You can obtain information about your customers’ experiences across the journey but also their experiences with competitors. This data can highlight your company’s strengths and weaknesses and suggest opportunities for improvement.
Setting priorities. Survey data that simply reports CX across the journey is often not actionable. The main question management wants to answer is: What are the top five issues or POP customers are encountering and how much are they costing us? Once key customer POP have been identified, priorities must be set. Surveys usually report key drivers of the desired outcome such as satisfaction, effort, loyalty or value for price paid. These can be reported in a vacuum or within the context of operations such that management understands which priorities can be realistically addressed. This financial component estimates the revenue damage and, ideally, the WOM damage of not addressing a problem. The table provides a simple example of such a business case for top issues.
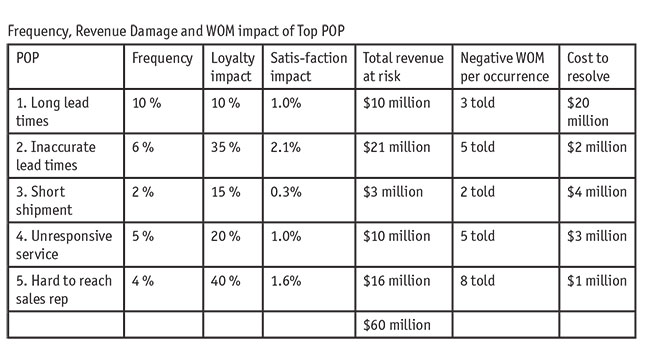
Combining survey, operational and complaint data and employee input creates a complete picture of the problems and their cause(s), the cost of resolution and the cost if not resolved. Goals can then be established based on a cost/benefit analysis. In this example, data systems to render lead times more accurate (POP 2) and improved processes to make sales reps more accessible (POP 5) should cost $2 million and $1 million, respectively. Significantly reducing or eliminating POPs 2 and 5 is estimated to provide a payoff of $21 million and $16 million each, delivering ROIs over 500 percent. These two POP are identified as cost-effective priorities.
Outcome goal-setting. Once priorities are established, goals for improvement can be set. The rational approach to goal-setting is to identify a limited number of attainable objectives and set annual goals for improvement. The goals can be outcome-oriented – for example, a 3 percent improvement in satisfaction ratings. This type of outcome goal can be applied to a transaction or an overall customer relationship. In the above example, if Problems 2 and 5 are mitigated or eliminated, satisfaction should rise by over 3 percent (2.1 percent plus 1.6 percent) so a 3 percent increase should be more than attainable.
A second type of goal can be a process goal. Process goals are metrics applied to a process such as the percentage of calls closed on first contact or number of on-time deliveries. The benefit of using process metrics is that you can see if the process fix is having a positive impact without having to execute a new survey. Ultimately, you want to confirm the indications of the process metrics with outcome measures of satisfaction gathered by fielding a new survey, which confirms that the targeted points of pain have diminished in prevalence.
Beware of a common error in objective-setting. I recently received a call from a client asking advice on setting next year’s overall CX satisfaction objective. The client stated, “We are at 84 percent satisfied, so we were thinking of 87 as the goal.” Why 87? “It’s higher than 84 but a reasonable lift we hope we can achieve.” This is the wrong answer. Goals should not be arbitrarily set. Goals should be based on an assessment of how much progress can be made on the metric if specific defective processes producing a measured amount of dissatisfaction are improved.
One leader must be accountable
An action plan has the role of specifying which POP will be addressed; how they will be addressed; the expected improvement in outcome metrics such as satisfaction or loyalty for each POP; and a responsible leader. As noted in the book The Amazon Way, almost all problems are cross-functional but one leader must be accountable for action.2 A single functional leader is designated to lead on each issue and for obtaining the cooperation from other functions on the issue team. Short-term success is measured via process metrics.
Process goal-setting. For one recent client, customer dissatisfaction was being caused by the invoice error and adjustment process. When the process fix was proposed by the continuous improvement department, we established operational baseline metrics for calls about invoice errors and for repeat calls about adjustments per 100 orders. We set a goal of a 50 percent reduction in calls for errors and a 70 percent reduction in repeat calls. Since there were operational records for both items, it was easy to discern within two weeks that the process fixes actually had a positive impact. When the next satisfaction survey was executed, customer dissatisfaction with the invoice process had almost disappeared.
Tracking progress of the organization and individual
Tracking an organization’s progress is easy using aggregate-tracking survey data based on surveying thousands of transactions per month. Even a 10 percent survey response rate assures statistical validity for measuring unit and corporate performance. Where difficulty arises is when surveys are used to evaluate an individual CSR’s performance using a small number of surveys. In most organizations, only two to five surveys are received per CSR per month – certainly not a valid sample.
Validity is further eroded if the survey questions apply to the organization rather than the individual CSR. For instance, one company evaluated representatives on the customer effort expended to resolve their problem when almost all customers had first visited – and been frustrated by – the company website. In another company, the CSR was evaluated by the NPS question: “How likely is it you will recommend [the company] to an associate?” The score assigned was not attributable to the CSR but included the website experience, product quality and product fill rate – none of which the CSR had control over. Management must place small numbers of surveys within a broader context of call observation and transaction type.
Greater causes of dissatisfaction
A majority of companies I’ve audited devote the bulk of survey effort and resources toward evaluation of the frontline CSRs. Systemic problems in service, marketing and product performance are always greater causes of customer dissatisfaction than the CSR-controllable behaviors and skills. Therefore, the majority of analytical effort should be devoted to diagnosing the contact center process, the website self-service function and the corporate sales, marketing and customer onboarding process rather than creating fancy CSR feedback platforms.
The analysis must provide an economic imperative for action. Each POP must be converted into the number of customers or revenue at risk due to the problem. In my book, I outline two economic models that quantify the cost of inaction. The market damage model quantifies the revenue loss and word-of-mouth damage of the overall status quo. The market-at-risk model quantifies the revenue damage of specific problems and POP. The two models together identify which problems should be attacked to achieve the highest ROI. Many companies, including 3M, Chick-fil-A, Whirlpool, Toyota and USAA have found the models an effective tool for jump-starting their CX initiatives.
Results must be packaged so that the internal organizational customer will take the time to read the report. Your survey report is competing with numerous inputs the manager receives that day – make it one of the easiest to digest. A good test is to ask five recipients what action they took based on last month’s report. If they took none, the report should be revised.
The report should start off with a summary that answers the question, “Why should I devote five minutes to look at this?” The answer must include an impending threat as well as a carrot of economic or career gain if action is taken. Further, the summary should allude to a positive area of high performance that makes the unit look good. The reader will forge ahead to learn more about that golden nugget.
Best practices for increasing survey impact
Prepare management for bad news. Remind management that while most customers are generally satisfied, the opportunity for enhanced profit and revenue rests with those customers who are either dissatisfied or not delighted, just satisfied. The gold lies in the bad news, not the good news. Additionally, highlight good news to recognize and motivate employees.
Place survey findings in context. Surveys should be used as one of at least four data sources: contacts/complaints; operational failures; visits and focus groups; and employee input. The operational data will reveal how many customers had the problem while the survey will explain the damage caused by each point of pain. Complaint data will explain where customer expectations or errors contributed to the problem. Employee input can further explain customer-based issues while also highlighting internal processes that cause the POP.
Give customers a good reason to take the time to respond. Customers are being bombarded with surveys, often multiple times a day. We have found that if the invitation indicates two actions recently taken based on previous customer input, a potential respondent will view the effort of completing the survey as a good investment. They think, “If you’ve paid attention to input in the past, maybe you’ll fix the things that drive me nuts about your company.” We’ve seen significant increases in response rates when such a message is provided.
Package the survey results to create action. Specific suggestions include: summarize the top three opportunities and the monthly cost of no action; tailor the findings to the individual recipient – while this takes more effort, it leads to greater impact; tie the results to an operational metric that the function takes seriously to ensure relevance; follow up each report with a short meeting to clarify (which also stimulates the recipient to read the report).
Placed within context
Surveys will have more impact if they have clear objectives, are linked to other types of data and create a business case for action. To be cost-effective, surveys must be placed within the context of operational, customer contact and employee input data and be accompanied by an action plan fixing accountability for addressing the priority issues identified. Further, unless many survey responses are obtained for an individual employee, surveys should be used sparingly for individual evaluation and only in concert with observations and operational data.
References
1 John Goodman and Scott Broetzmann, Strategic Customer Service, 2019.
2 John Rossman, The Amazon Way, 2016.