Editor's note: Michael Lieberman is founder and president of Multivariate Solutions, a New York statistical consulting firm. He can be reached at 646-257-3794 or at michael@mvsolution.com.
Segmentation is the process of classifying a market or customer base into distinct attitudes or behaviors. The segmentation process entails segment identification, segment characterization, evaluation and target segment selection. Market structure, consumer perceptions, shopping behavior and branding images are all taken into account.
There are many ways to make better decisions and improve market ROI. Segmentation can help the client: enhance new product development; make sense of patterns of consumer behavior linked to a brand or product; and determine the motivations for consumers to buy their product or service.
Segmentation cuts in different ways (pun intended!). We are going to focus on one. I will describe a particularly effective tandem method we often deploy for comprehensive segmentations. The tandem method is to conduct a factor analysis, followed by a cluster analysis. The technique is post hoc (data collected from a consumer survey) and covers not only the usual suspects of frequency and purchase behavior but also lifestyle and attitude issues that are associated with product usage. It combines many different dimensions of brand consumption and blends them into specific and informative characterizations.
Our fictional client is the Guaranteed Food Corporation (GFC). GFC is commissioning a major study for its Health Valley line of products, which includes healthy selections for breakfast, granola bars and other processed healthy food choices. The sample is comprised of those respondents who claim that they purchase healthy food alternatives on a regular basis.
The lengthy questionnaire explored a range of purchasing, behavioral, health and lifestyle attitudes. GFC’s goal was not simply to identify its core customers but to also understand them. The company wanted to continue its bond with Health Valley’s main consumers and also attract more like-minded people to the Health Valley product line. GFC wanted to dig deep to give the Health Valley brand team the full picture. We were going to provide it.
Measure of separation
Every post hoc segmentation needs a measure of separation between the final segments. These are often referred to as business rules. The three most common business rules are: latency of purchase, frequency of purchase and amount spent.
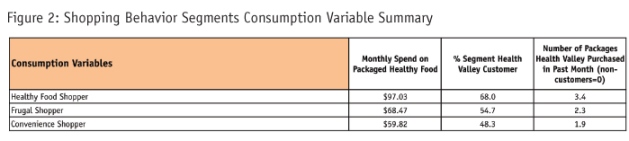
Consumption variables in the Health Valley study are de facto business rules. They are variables within the study that allow us to compare segments based on important discriminators for the Health Valley brand. Consumption variables are descriptive; that is, they are used for comparison purposes between segments and are not input into the cluster analysis itself. Below are the consumption variables – business rules – that we used to compare Health Valley segments:
- monthly spending on packaged health food;
- percentage of segment that are Health Valley customers;
- number of Health Valley products purchased in past month (non-customers=0).
Among other questions, the Health Valley questionnaire contained arrays of attitudes that respondents were asked to rate on a discrete (1-to-7) scale. For the segmentation, the following dimensions were queried:
- food purchase behaviors;
- exercise and wellness activities;
- lifestyle attitudes;
- shopping behavior;
- health food attitudes; and
- motivational reasons for healthy living.

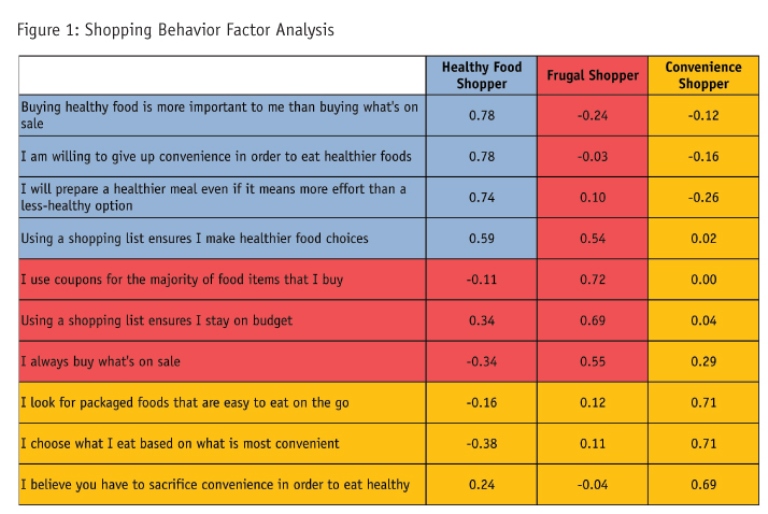
The first step is to use a common marketing research technique, principal components analysis, commonly referred to as factor analysis. Factor analysis finds underlying structures of association between variables. Put another way, factor analysis creates “families” of attitudes that tend to be rated similarly. Figure 1 shows one example output of the six factor analyses run for this study. The names of the factors at the top (e.g., Healthy Food Shopper) are subjective and are normally based on the attitudes contained in the analysis. Figure 2 shows the consumption variables by each of the three shopping behavior segments.
When programmed, factor analysis creates variables for each factor. Each respondent receives a factor loading (similar to a correlation coefficient) for each factor. For our example, three new variables were created. Each respondent received a score for each of the new variables. A respondent is placed into the family where he/she has the highest score.
For the six Health Valley factor analyses we set each factor analysis to have three factors (they generally run between three to six). The table in Figure 3 summarizes the families (factor analysis results) that were created.
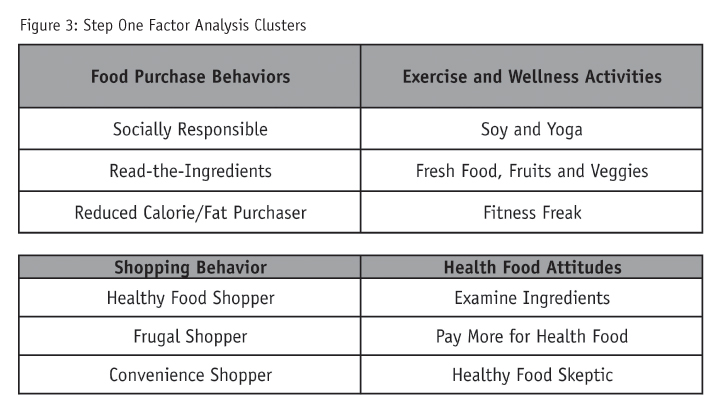
To sum up, what we have created are six new variables, each with three values. Each respondent has one value in each of the six new variables.
Perfect second step
K-means cluster analysis aims to partition observations into x number of clusters in which each observation belongs to the cluster with the nearest mean, serving as a framework of the cluster. K-means is not my favorite clustering algorithm: if the data is varied, the results can be murky. The k-means algorithm, on its own, is too sensitive to outliers. However, for our tandem method, it is the perfect second step. I’ll explain below.
We have six new variables, each with three values. Our next step is to create a new variable for each value. That is, for the first segment variable, for the first value, a respondent receives either 1/0. If he has a 2 for that segment, he receives a 1 for the second new variable.
Essentially, we create 18 new variables. Each respondent has a value of 1 in six of these. K-means clustering now comes into play. Given that this method works on Euclidean distance, we are able to calculate each respondent’s distance from other respondents based on their six new variable memberships.
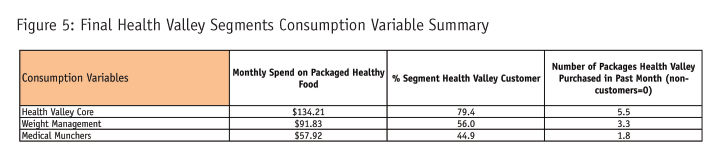
We can see which of the 18 subgroups are in close proximity. In order to simplify the example, we have reduced the Health Valley solution to three consumer groups. Here are the final segment results for the Health Valley study:

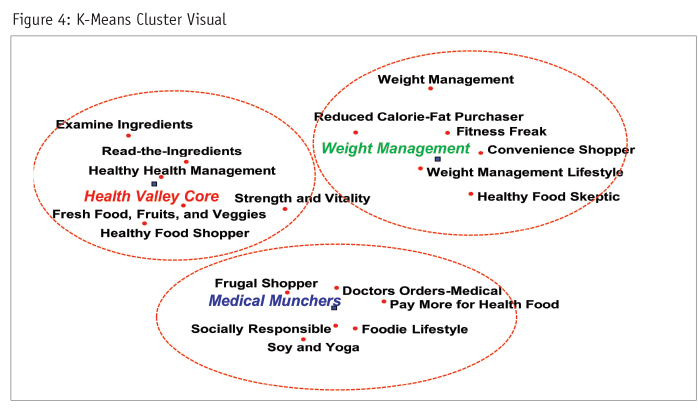
Figure 4 shows a multidimensional scaling visual based on the same Euclidean distance employed in k-means. It shows which step-one clusters surround our final Health Valley segment solution. Figure 5 shows the consumption variables by the final Health Valley segments.
Key data
Now that the two-step process has been completed, we have some key data about the Health Valley core customer:
- They make up about 30 percent of the health food market.
- They tend to purchase vegetables along with Health Valley products.
- They view “health and vitality” as a central diet vision.
- They read the ingredients of the products they purchase.
Within the six dimensions that were synthesized, in step one of the segmentations there were more than 70 individual statements. GFC would like to know which of those are major drivers for messaging Health Valley customers. So, among the next steps Health Valley could take is to run descriptive regressions to characterize the individual statements that might appeal to present and future Health Valley consumers using statistically significant descriptors.
Many companies run large segmentations and then use the results over the next few years to classify respondents for additional studies. The next step for Health Valley, then, would be to develop a reclassification scheme for its segmentation. Ideally, it would like to produce a screener that asks prospective respondents several questions in the screener. The field house would then have an algorithm that would classify them for purposes of questionnaire skip patterns and tabulations.
We generally provide that service, using a series of regressions and then a discriminant analysis method to narrow the screener to, say, eight to 10 questions that would classify future prospects into the Heath Valley segmentation.
Vital marketing tool
Not every dollar spent on advertising and sales is created equal – some of those dollars generate far more revenue than others. Segmentation is a vital marketing tool. Peter Drucker had it right when he spoke of the art of segmentation and its marketing extension: “The aim of marketing is to know and understand the customer so well the product or service fits him and sells itself.”