Editor’s note: Kristen Miles is director of insights at Branded Research, San Diego, Calif.
As researchers, we make many choices when visualizing data for our internal stakeholders. Do we show results in a chart? Or just the topline figures? Our choices impact how our clients interpret the results of a study and how they make decisions using the results. Research shows that people will interpret the results of a study differently based on the graphical display we choose, how we choose to label our visualizations and the level of granularity of the data. To ensure success, data visualization must be at the forefront.
A recent study using customer reviews by researchers at Yale School of Management demonstrates how the interpretation of ratings can be distorted based on how the results are displayed. Typically, customer reviews are communicated on Web sites via five-bar histograms. Research shows that the so-called binary bias plays an important role in how individuals evaluate customer reviews. The results of this study can be extrapolated to the market research industry and how we evaluate survey data.
Impacting data
People tend to make a categorical distinction between positive ratings (4-5 stars) and negative ratings (1-2 stars). However, within those buckets, people do not sufficiently distinguish between the more extreme values (5s and 1s) and the less extreme values (4s and 2s). As a result, people’s subjective representations of distributions are heavily impacted by the extent to which those distributions are imbalanced.
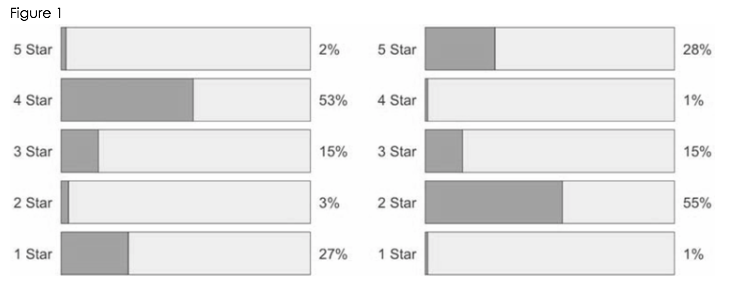
To demonstrate this phenomenon, researchers set up several experiments using customer reviews. In the first of the experiments, participants were shown reviews with identical means but different underlying distributions (Figure 1). In this case, the top-heavy review was seen as more positive to participants than the bottom-heavy review. Participants have a positive gut reaction of the top-heavy distribution because of the way the data is visualized. Researchers have proven out this phenomenon using both hypothetical and real-world review examples.

The second experiment proved that participants’ interpretation of data is heavily impacted by how data is displayed and the granularity of the data provided. Participants were shown only mean review ratings for two restaurants and not the full distributions. The experiment was set up such that the restaurant with the lower mean had a top-heavy distribution and the restaurant with the higher mean had a bottom-heavy distribution. When participants were shown only the mean, they selected the restaurant with the higher average rating. However, when presented with the distributions, participants selected the restaurant with the top-heavy distribution even though it had a lower true mean.
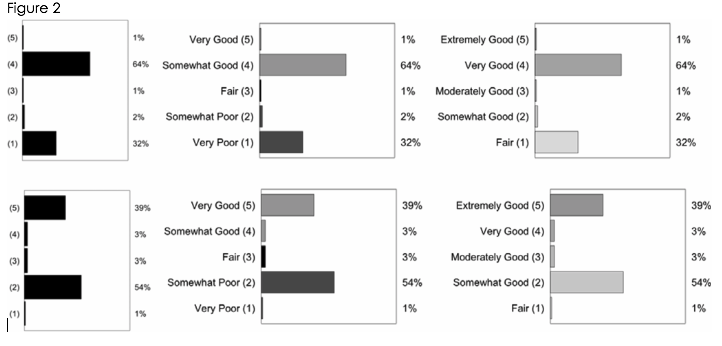
A third experiment demonstrated that how researchers label charts has a significant impact on how data is interpreted even when the underlying distributions are identical. In this test, the distributions of one case were labeled with a range from very poor to very good, while in another case the distributions were labeled from fair to extremely good. An unlabeled review distribution was included as a control. The results showed that the unlabeled distribution was interpreted in a nearly identical manner to the distribution with the rating of very poor to very good. This suggests that participants naturally interpret histograms in terms of binary categories. Participants’ interpretation of the distributions with the range of very poor to very good was significantly different from the distribution with the rating of fair to extremely good.
Connecting the dots
These experiments have important implications for how market researchers choose to present survey results, particularly Likert scale questions. We are driven by categorical thinking. We are always trying to create categories and connect the dots. How researchers choose to create categories when analyzing market research data and presenting findings has a significant impact on how the results are interpreted.