Survey (kinda) says
Editor's note: Marco Vriens is CEO of Kwantum. Chad Vidden is COO of Kwantum. Rogier Verhulst is senior director – central market research, operations and marketing at LinkedIn.
With the introduction of ChatGPT by OpenAI and Microsoft, AI has become a major topic of discussion no matter where you go. Firms on the client side and the supplier side alike are scrambling to determine how to think about AI and how to possibly use it in their business. One exciting application of AI techniques lies in the creation of artificial or synthetic marketing research data.
Why would we want to use synthetic data if we can have real data? For several reasons. First, synthetic data can aid in the development of better models – better in the sense that synthetic data can help us understand and predict our real data better. Second, we will show that with the advances in ChatGPT we can generate complete survey responses that can in some cases eliminate the need to ask survey questions at all.
The latter is useful for multiple reasons. One, it can help us augment small sample sizes when we are dealing with hard-to-reach audiences. Two, it can save time, which is sometimes a vital decision factor as to whether to collect data at all. Three, it can save money.
In this article we review two techniques: creating artificial respondents using the synthetic minority over-sampling technique (SMOTE) to improve predictive models and segmentation typing tools; and creating artificial respondents using ChatGPT.
We discuss these two techniques in terms of viability, readiness and proven validity.
Synthetic data
Data that is being generated artificially is often referred to as synthetic data. There are different ways in which this can be done, depending on what you want to use the data for. A popular approach that has been used for years in data science is the SMOTE technique.
Using SMOTE to improve prediction of brand choice
In initial qualitative research, our client became aware that there was an emerging competitor. They decided to include this competing brand in their tracking study. Few respondents were aware of this new brand and for every nine respondents that are aware of their brand only three are aware and know something about it. In the survey, they also asked about brand preference and only one out of 10 prefer this competing brand. Both brands were also evaluated on a small set of brand attributes:
- This is brand I trust.
- This is a high-quality brand.
- The overall value of this brand is great.
- It is easy to get value out of this brand.
The initial predictive model tried to predict preference for the client’s brand vis-à-vis the competing new brand as a function of various brand attributes. We used a standard predictive modeling approach, i.e., logistic regression (see Vriens and Vidden, 2022).
The model had a good fit but nothing interesting came out of it. There were two problems.
First, the model simply predicted most to prefer our client’s brand and where it predicted the emerging brand, it predicted wrong. The model achieved a 90% hit rate by doing that. At first glance, you would think that a model that predicts with 90% accuracy is quite good. However, that 90% is deceiving because the model did not predict anyone to prefer the emerging brand (see Figure 1).
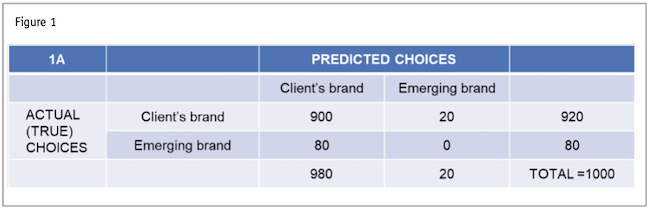
Second, there were no significant effects in the model, i.e., none of the ratings on the brand attributes had any predictive value in predicting whether a respondent preferred the client brand versus the emerging brand. No insight was gained as to what was driving preference of one brand over another.
The problem is the imbalanced nature of the dependent variable, skewed heavily towards the client’s brand. We can create more balance by creating synthetic respondents who prefer the competing brand by using synthetic minority over-sampling technique. (See Chawla et al., 2002.)
SMOTE roughly works as follows. Pairs of respondents are selected. One respondent from the pair prefers the client’s brand, the other prefers the emerging brand. These pairs are chosen in such a way that they are similar in other respects (on demographics or other survey questions). Then, a new “respondent” is generated that has values on the other survey questions that randomly lie between the two real respondents.
As a simple example, say one respondent prefers the client’s brand and gives it a trust rating of 7; another respondent is very similar on the client’s brand but prefers the competing brand and gives it a trust score of 6. The new respondent will have the same values as both original respondents and will be said to have given a trust score that lies between 6 and 7, say 6.7. This is done for all variables that are part of the typing tool model and on which the two original respondents have different values. So, even though this new respondent is artificial data, it is still derived from real data. This process of creating new respondents continues until we have the same number of respondents who prefer the client’s brand and the emerging brand.
We applied this method in the above case study. The results were dramatic in two ways:
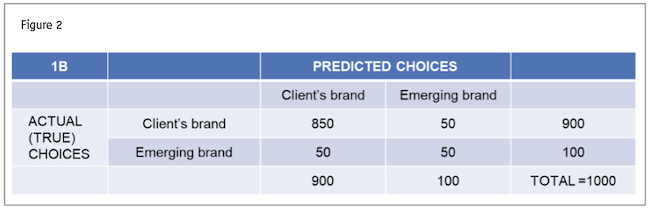
- The model still predicted about 90% of the brand preferences correctly. If you look at Figure 2, you can see that the emerging brand is now predicted with 50% accuracy, whereas before applying SMOTE it was 0%. This is significant because we want to be able to predict what’s driving preference for this emerging brand.
- There were several interesting statistically significant independent variables. In our hypothetical case, for example, we found that trust and overall value were statistically significant predictors of brand preference. Hence, in this application our AI approach substantially improved the insights.
Using SMOTE to improve segmentation-typing tools
A firm had done a large international segmentation study and had identified four segments. While one of the four was substantially smaller than the others, it was the most valuable one for our client: It contained high-value customers, a group among which the client felt they could compete very well.
They had a typing tool for their segmentation solution that tried to predict segment membership based on demographics and media usage variables, enabling them to understand their segments better in terms of demographics and would let them reach the segments via media. The problem was, the typing tool could not predict at all who was in that strategic segment and hence the client couldn’t figure how to reach its members. This is because predictive models don’t handle smaller segments very well.
As with the previously explored segment, the typing tool can achieve a good overall accuracy by predicting the largest segment but that does not give us the insights we need. Thus, we applied SMOTE. We artificially increased the size of this smaller segment to match the biggest segment so that the predictive model can’t just focus on the largest segment.
In order to get a good overall prediction it has to predict all segments well. SMOTE is applied to all segments that are smaller than the largest segment until all segments have the same size. We do this because when all segments have the same size, the predictive model cannot achieve a high hit rate by predicting only one segment well. It has to do a good job with all segments.
The predictive accuracy for this segment increased from 0% to 90%, while only marginally decreasing the degree to which the other segments could be predicted – a truly astonishing result because everyone who develops predictive models knows how extremely hard it is to get substantial improvements in models. Whereas the standard approach could not predict segment membership at all, after applying SMOTE, we can predict this valuable segment very well (see Vriens et al., 2022, for details).
Using ChatGPT to generate artificial survey results to reduce costs
ChatGPT is another LLM model. Brand, Israeli and Ngwe (2023) were among the first to use the ChatGPT model to generate fully artificial responses to survey questions. Note that such data is artificial because the respondents and responses that are generated don’t exist. However, they are in essence created from many respondents that have posted comments online on the topic the survey question is about (e.g., discussion boards, product reviews, etc.).
They created artificial survey responses from people making choices between two brands with two different prices. The price of the first alternative was kept constant whereas the price of the second alternative went up. As expected, the percentage of “respondents” choosing Alternative 2 went down as prices went up. They also repeated this but are now asking ChatGPT to find respondents with a higher income. As expected, the price sensitivity of these respondents was lower. So, it seems that at least directionally ChatGPT might get it right.
Example
ChatGPT can help with response generation and analysis of any survey question. We tried several examples, from generating artificial responses to open-ended questions; to unaided awareness; to brand ratings. Here we show the steps to generate open-ended question responses, following the methodology described in Vriens, Chen and Schomaker (2019).
We first wrote a set of prompts (not shown here as they are proprietary) with three parts: 1) phrases an open-ended question, 2) creates response summaries, and 3) frequency tables (we note that there are many other options for analysis; this is just a simple example). There are three parts: the survey question, the demographic we are interested in and further instructions:
Part 1: The survey question and response
Prompt:
Survey question: “What comes to mind when thinking of the brand LinkedIn?”
Demographic: “Your task is to respond to a single open-ended question as if you were demographic X.”
Further instructions: “Give a typical length of response to the survey question. Provide responses across groups of respondents that differ in their likelihood to recommend score (rating between 0-10). Make sure we have Detractors (rating 0-6), Passives (rating 7-8) and Promoters (rating 9-10).”
This script will generate the response of one respondent, so to get a sample we have to run it a number of times (100, 500, etc.) depending how large you want the sample to be.
Response:
“When I think of LinkedIn, the first concept that comes to mind is professionalism. It is a platform where people can showcase their experience and skills to potential employers and their connections. The networking concept is also a key concept as it allows individuals to expand their network and potentially find job opportunities. It is also a great resource for job searching and career development whether it be through job postings or industry-specific groups. Overall, I view LinkedIn as a valuable tool to advancing my career. (Linda, age=28, 8, Passive).”
Note: In the prompt, we can indicate what range in ages we want, how much variance across respondents, etc.
Part 2: Response summary
Prompt:
“Your task is to summarize the consumer survey response. Use 10 words or less.”
Response:
“Professional networking, job opportunities, career development.”
Part 3: Theme extraction
The last part in our example is to get a quantitative summary of the frequency with which associations (concepts) with LinkedIn have been mentioned across our hypothetical sample.
Prompt:
Format: CSV format
“Your task is to extract the top key concepts.”
Response:
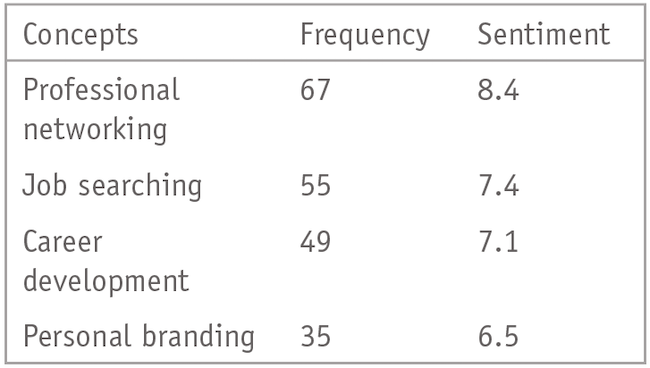
More proof points needed
We have explored the benefits of SMOTE, a viable and proven methodology, and also showed that ChatGPT can potentially dramatically reduce the cost of insights and help with hard-to-reach audiences – though more proof points about its validity and usefulness are needed.
Creating artificial responses using ChatGPT also complements primary research in validating overarching conclusions. In other words, it can strengthen the findings if ChatGPT results point to similar implications, providing the organization with more confidence to act on the findings.
Using ChatGPT as a valid alternative to generate survey data is still an emerging capability. We don’t yet know when and to what degree the ChatGPT-generated respondents will give insights similar to survey results based on real respondents’ data and, related to that, if ChatGPT will be able to gather the same level of confidence from stakeholders.
We note, however, that we implicitly assume that real survey data is the gold standard. Survey research has limitations: it suffers from low response rates and increasingly problematic data quality from those who are responding (see Vriens, Elder and Holland, 2023). It might very well be that ChatGPT-generated data are simply a different part of the truth and serve to complement insights from traditional survey data collection.
References
Brand, J., Israeli, A., and Ngwe, D. (2023). “Using GPT for market research.” Working paper 23-062, Harvard Business School.
Chawla, N.V., K.W. Bowyer, L.O. Hall, and W.P. Kegelmeyer (2002). “SMOTE: Synthetic minority over-sampling technique.” Journal of Artificial Intelligence Research 16: 321–357.
Vriens, M., Bosch, N., Talwar, J. (2022). “How to build better segmentation typing tools: The role of classification and imbalance correction methods.” In Sawtooth Software Proceedings, May 2022, Orlando.
Vriens, M., Elder, A., and Holland, S. (2023). “The good and the bad: Taking a more holistic view of data quality.” Quirk’s Marketing Research Review. July/August 2023.
Vriens, M., and Vidden, C. (2022). “From Data to Decision: A Handbook For The Modern Business Analyst,” second edition, Cognella Academic Publishing.