Editor’s note: Paul Abbate is the senior vice president of Ipsos Public Affairs’ Omnibus Services business in the U.S. This is an edited version of a post that originally appeared here under the title, “Millennials bank on a better financial future.”
Well as much as I would like to say to Millennials, “pull up your boot straps and let’s get it on,” the U.S. is wallowing through its third decade of stagnant wage growth and the gulf between the top 1 percent and the middle class is large.
In fact 15 percent of the Millennials are currently unemployed, many are already pushing back retirement dates and most haven’t even begun to put a strategy in place for long term savings. It’s the sign of the times, and not the sign of the Aquarius.
Millennials have aspirations but are hindered by the economic stagnation. In a recent study by The American Institute of CPAs, three-fourths of Millennials want what others around them have, half use a credit card to pay for ongoing monthly expense and one-fourth have missed a payment on a credit card, bank loan or other debt instrument in the past 12 months.
What’s the court of public opinion have to say on the issue?
In this month’s Though Starter from Ipsos Public Affairs, Most Millennials Eschew Weddings For Retirement Funds, we investigate the financial situation of Millennials, and their spending and saving habits, as they come of age during spend thrifty and belt tightening economic times of the early twenty-first century.
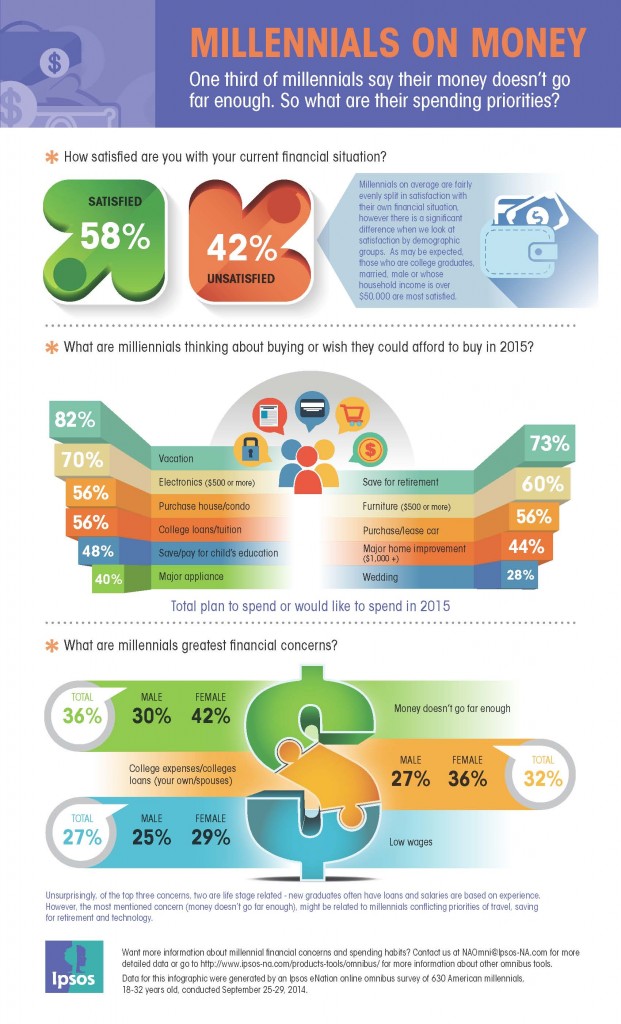
Conducted in October 2014, the results found that the majority (58 percent) of American Millennials currently feel pretty good about their financial situation. This shocks me. Why? Unless I am living on Survivor Island with only a jar of Peanut Butter (I have no nut allergies), I wouldn’t feel pretty good about working and growing up in my formative post college years during a Recession/Depression. It must be the Gen-X in me pouring out from a can of Mountain Dew (the drink not the Jerry Garcia song).
As with most segments of the U.S. population, Millennials aren’t too dissimilar from Johnny and Suzy Q. Public when it comes to what keeps them up at night and causes them financial concern. When asked what are your top financial concerns, Millennials cited money doesn’t go far enough (36 percent), college expenses/loans (32 percent), low wages (27 percent) and paying off credit cards (24 percent) as their top concerns.
Debt du jour with a side order of credit card-poutine has affected more than just Millennials earnings potential and savings potential. Credit scores find themselves sliding down the wire into the abyss.
Bankrate.com fielded a study in February of 2014, which talked about the challenges staying afloat on the S.S. Millennial. It’s about making good decisions, and balancing living expenses with discretionary expenses. One key data point shows the challenges of keeping credit scores in good standing:
- 18-24 years old (Millennials) 638 (Avg.)
- 25-34 years old (Millennials) 655 (Avg.)
- 35-44 years old 660 (Avg.)
- 45-54 years old 685 (Avg.)
- 55+ years old 725 (Avg.)
We were curious what Millennials plan to spend their money on in the coming year. So when asked, we were happy to see retirement top the list and weddings (no offense Bridezilla) at the bottom of the list. Saving for retirement came in at 45 percent, closely followed by vacations (44 percent), college tuition/loans (36 percent) and weddings (16 percent).
 Is it a sign of the sensible times, or the fact an average wedding in 2015 is estimated to run you a cool $25,200, as cited in Wedding Report 2014?
Methodology
Each week Ipsos U.S. eNation online omnibus completes five national online surveys. Each survey consists of a minimum of 1,000 completes with adults 18 years of age or older in the contiguous U.S.A. The sample consists of individuals selected from the online segment of Ipsos’ iSay/Ampario Panel, and is balanced to be representative of the general population based upon region, gender, age, and household income data from the U.S. Census Bureau. Survey results are tabulated by two standard demographic banners:
- gender, age, household income, region; and
- child in household, education, employment status, marital status, race.
Standard data tabulations are provided in a weighted format. The data are weighted to give appropriate representation on various demographic factors, including: age, income, the four national census regions, and gender. The Current Population Survey from the U.S. Census Bureau is used to determine the weighting targets for each demographic factor.