Editor's note: Michael Latta is executive director of YTMBA, a Myrtle Beach, S.C., research and consulting firm. He is also a professor of strategic marketing in the Wall College of Business Administration of Coastal Carolina University, Conway, S.C.
Research incentives and response rates in surveys have gained in importance, especially as response rates decline. This article looks at a study on setting and meeting expectations, incentive amount and time involved in research participation as factors affecting willingness to participate in future health care marketing research. The results show that expectations and incentive amount do increase willingness to participate in future marketing research. The results also show that setting and meeting expectations is three-and-a-half times more important than incentive amount in encouraging willingness to participate in future marketing research. No impact of length of research session was indicated. These results have implications for building panels of research participants and future response rates.
Many practitioners and industry organizations have addressed the topic of incentives and response rates. For example, the Council of Professional Associations on Federal Statistics held a conference in 2010 dealing with the issue of whether incentives are necessary. That same year, a study by Glaser for the Marketing Research Association (MRA) reported that federal and state governments were trying to curtail the influence that pharmaceutical, biotechnology, medical device and medical supply companies may gain through the use of incentives in marketing research. A total of 576 physicians from various specialties participated in an MRA-sponsored Web survey to gather opinions on the importance of incentives in recruiting and cooperation. The results showed that nine out of 10 physicians said that incentives play a role in gaining participation and less than one in 10 said that they would participate if no incentive were offered.
Qualitative research indicates three main reasons respondents give for responding to surveys: wanting to be helpful; money or other economic incentives; and an interesting topic or trust of a sponsor.
A meta-analysis by Church showed effects of incentives on response rates in cross-sectional mail surveys, with prepaid incentives being stronger than promised incentives or no incentives. Monetary incentives were found to be stronger than gifts and more money is stronger than less money. In an experiment on cellphone use and incentives by Brick and colleagues, a promised incentive of $10 led to a higher screener response rate than a promised incentive of $5 and also led to a higher cooperation rate to the survey overall.
More recently, an experiment was conducted by Singer and Ye in the online environment using four different formats with an eBay customer list of over 1,900 respondents. Recruiting was done by e-mail invitation that had a link sending respondents to a seven-minute online survey. The four-cell design included incentives and cosmetic features such as color, shading and HTML tables in the survey. This design was set so that the expected value of each combination of design features and incentive amount was the same. Completion rate was defined by the number of respondents divided by the number of people who viewed the first page and went no further. Data quality was defined as accuracy of responses to questions about purchases on eBay linked back to purchase history data provided by eBay. These data indicate incentives increased completion rate and had little or no effect on data quality. Results for satisfaction were not as strong as those reported in a 2003 IMRO study (65 percent vs. 70 percent) when incentives were present but still showed incentives enhanced overall satisfaction by 9 percent.
These studies are limited in the size of incentives offered and the number of research methodologies included, with online dominating. They also have limited variability in respondent types included and in length of required participation. They do not address the issue of respondent attrition from unpleasant research experiences such as not meeting expectations created in recruiting. The question still stands: Why are response rates of experienced respondents declining?

Current study design
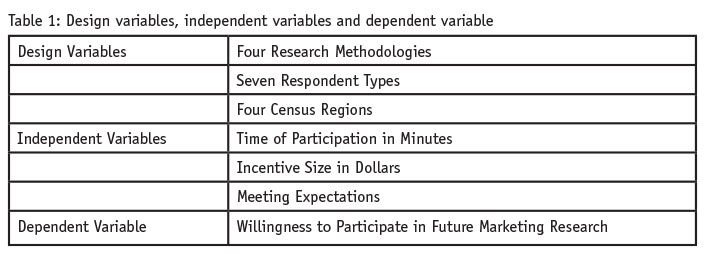
To broaden the range of levels of design variables and analytic variables, the current study of includes the design in Table 1.
Both qualitative and quantitative approaches were included in the sample of 729 respondents. The four methodologies, two qualitative and two quantitative, were phone surveys, self-administered surveys, focus groups and in-depth interviews. There were seven different respondent types including pharmacists, child/neuropsychiatrists, consumers, FP/GPs, IMs, nurses and pediatricians. The four census regions were Northeast, Midwest, South and West.
Independent variables included:
• incentive size in dollars, which ranged from $5 to $250 depending on respondent type and the project methodology;
• the time of participation in minutes, which ranged from two to 120 minutes; and
• meeting expectations set during recruiting (time, incentive size and survey topic), which was measured on a 10-point scale where 1 = much worse than expected and 10 = much better than expected.
The dependent measure, willingness to participate in future marketing research, was measured on a 10-point scale where 1 = definitely will not participate in the future and 10 = definitely will participate in the future.
Results and analysis
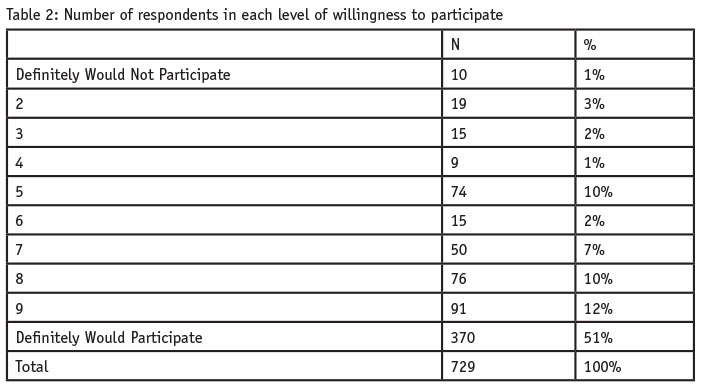
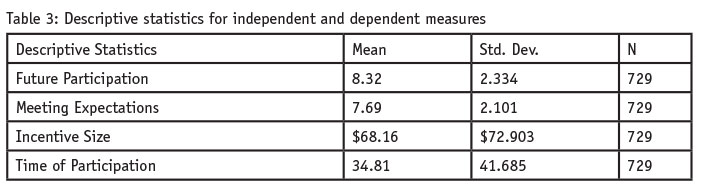
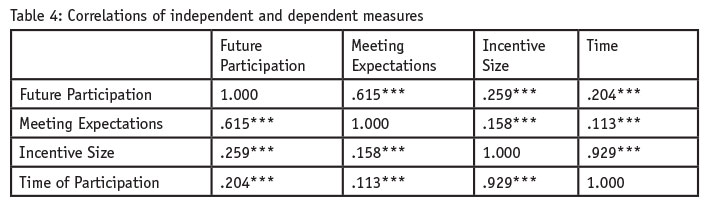
The study was completed over a calendar year. The distribution of willingness to participate in future marketing research appears in Table 2. The analysis utilized the whole sample since there are pockets of constant values in a methodology and missing values for some of the main variables in the overall design. The independent and dependent measure descriptive statistics are in Table 3. The correlations among the independent and dependent measures are in Table 4.
A stepwise multiple regression analysis was done using future participation in marketing research as the dependent variable and meeting expectations, incentive size and time as the independent variables. The final model showed meeting expectations and incentive size were significant predictors of future participation but time of participation was not. The results of this analysis are presented in Table 5.
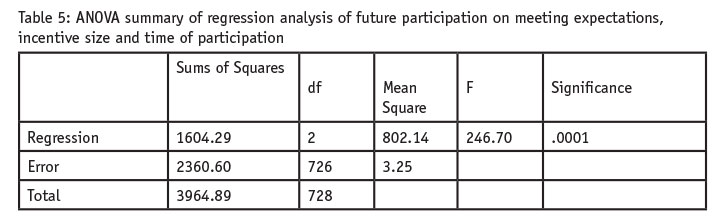
The adjusted r-squared for the two-predictor model was .403. The coefficients of the two-predictor model are in Table 6.
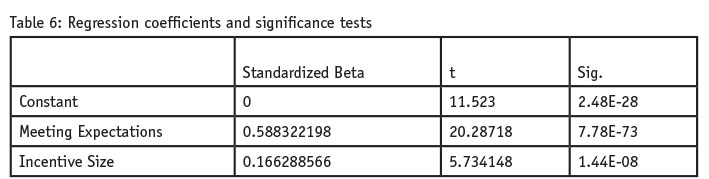
The regression equation is:
Willingness to Participate in Future Marketing Research = .588* Meeting Expectations + .166* Incentive Size + Error
Conclusions
A meta-analysis by Groves and Peytcheva of nonresponse rates and nonresponse bias showed that research design and sample characteristics predict both nonresponse rates and bias. The current study shows meeting expectations is more important in encouraging future participation in marketing research projects than either time of participation or incentive size. The size of the standardized coefficients indicate that setting proper expectations and then meeting those expectations for respondents appears to be three times more important than incentive size in getting potential cooperation for future participation. Because setting the expectations about the time of participation in minutes and the incentive size in dollars during recruiting is part of meeting expectations, it’s perhaps not surprising that meeting expectations is such a powerful predictor of future participation in marketing research.
In their work on physicians’ views of marketing research, Maciolek and Palish indicate that financial incentives are the primary reason for participating in online surveys 51 percent of the time. They note that physicians suggest marketing researchers should make as their No. 1 goal to “abide by the participation agreement (survey length, topic),” suggesting we need to meet expectations consistently that are created in recruiting.
Because the results are also consistent with the norm of reciprocity, they may apply to a wide variety of respondent types, research methodologies and honorarium amounts. The norm of reciprocity says people will respond favorably to each other by returning benefits for benefits and responding with either indifference or hostility when people are harmed or benefits are not forthcoming as promised. An underlying norm of reciprocity is a powerful engine for motivating, creating, sustaining and regulating the cooperative behavior required for self-sustaining social activities such as health care marketing research as well as for controlling the damage done by unscrupulous research suppliers.
In conclusion, setting and meeting expectations about things such as incentive size and the time of participation when recruiting participants for research projects should be a focus in both federal surveys and marketing research projects in health care and other industries. Meeting expectations and providing incentives are two important aspects of the marketing research process that affect the respondents’ post-project evaluation of the whole experience. Violating expectations may kill future participation and endanger recruiting and retention for marketing research panels.
REFERENCES
Brick, M.J., Brick, P.D., Dipko, S., Presser, S., Tucker, C., and Yuan, Y. (2007). “Cell phone survey feasibility in the U.S.: sampling and calling cell numbers versus landline numbers.” Public Opinion Quarterly, 71, 1, Spring, 23-39.
Church, Allan H. (1993). “Estimating the effect of incentives on mail survey response rates: a meta-analysis.” Public Opinion Quarterly 57:62-79.
Glaser, P. (2010). “Respondent cooperation: how big an impact will government legislation have on physician surveys in the U.S.?” Alert!, 50, 1, 43.
Gray, M., and MacElroy, B. (2003). “IMRO online satisfaction research: a pilot study of salience-based respondent experience modeling.” IMRO Journal of Online Research, July. www.websm.org/uploadi/editor/imrp.pdf
Groves, R.M., and Peytcheva, E. (2008). “The impact of nonresponse rates on nonresponse bias: a meta-analysis.” Public Opinion Quarterly, 72, 2 (Summer 2008), 167-189.
Maciolek, T. and Palish, J. (2009). “Faster than a speeding survey: Part II: the physician’s perspective. Quirk’s Marketing Research Review, July, 46-50. www.quirks.com/articles/2009/20090706.aspx
Mullins, C., and Plunkett, J. (2006). “Variables that influence dropout rates and data quality in Web surveys.” Quirk’s Marketing Research Review, July, 46. www.quirks.com/articles/2006/20060703.aspx
Singer, E., and Ye, Cong. (2013). “The use and effects of incentives in surveys.” Annals of the American Academy of Political and Social Science, 645, The Nonresponse Challenge to Surveys and Statistics, January, 112-141.