Editor's note: James Karr is director, respondent analytics, at Ipsos Interactive Services, Toronto. Jim Legg is vice president, global engagement, Ipsos Interactive Services, Chicago. Jason Fuller is director, global ROR, Ipsos Interactive Services, Toronto.
From a research perspective, the alluring promise of big data is its potential to deliver a wealth of household- or individual-level information far beyond what could typically be collected through traditional pre-screening and profiling techniques. Many big data companies have comprehensive demographic, financial and behavioral databases of the population that they claim can be leveraged to help identify specific target groups for subsequent research or marketing purposes. For example, core demographics such as age, income and ed-ucation could be used to predict the likelihood of a person being a small business owner and those with the highest probability could then be sampled for a survey to that target, with the expectation that the incoming sample would have a higher incidence than if one had randomly sampled from a panel or other online source.
But how accurate and reliable is the information in these databases? We wanted to know whether big data could help identify low-incidence, hard-to-reach targets on our panel and do so more effectively and cost-efficiently than a standard pre-screening survey could achieve. If successful, this service could allow sample providers to more efficiently sample from proprietary panels, as well as decrease the use and cost of third-party sources. So, in the context of maximizing in-house sample, does big data add value?
To address our questions, we tested two different services from a well-known big data company across three studies.
- A statistical model that predicted the likelihood of certain individuals having characteristics of interest that had been neither previously profiled nor were directly available in a big data database.
- A data “enhancement” product that appended pre-existing data at the individual, household or address level to selected panelists’ records, based on matching their name and postal address.
For both services, our key question was whether the big data product did a meaningfully better job in terms of identifying the low-incidence target group versus what we would have obtained through random sampling and screening from our panel. We have condensed the results according to which service we were testing.
Case study 1 and 2: Denture wearers (test/re-test) and ad service buyers
Product tested: Statistical model (predictive)
Method
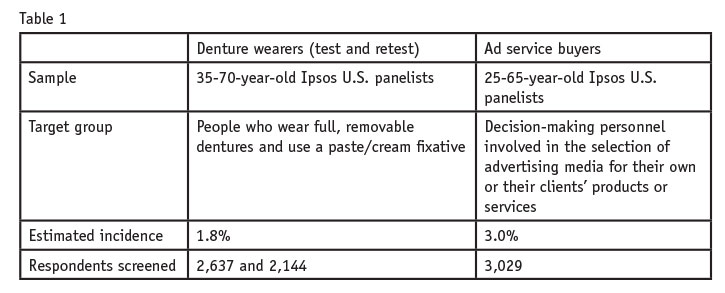
We delivered a name-and-address file of 122,000 U.S. panelists to a big data company, which presumably computed the probability of each panelist belonging to each target of interest (denture wearers and ad service buyers; see Table 1), and then sorted all 122,000 people into 20 equal-sized subgroups representing higher or lower likelihood of qualifying. For example, the 6,100 panelists in dentures rank group 1 were all considered “rank 1,” the group with the greatest overall probability of being denture wearers, and hence qualifying for the study. The 6,100 panelists in rank group 2 were “rank 2” and had the second-highest overall probability of qualifying, and so on.

We then randomly selected a subset of panelists from each rank group in the top 10 ranks to participate in the survey. There was no overlap between respondents in the denture wearers and the ad service buyers studies, and in the denture wearers study, different panelists were selected for the test versus retest legs.
Results
The denture wearers study was run in February 2014 and again in October to retest and validate the results. We examined the respondents in each rank group from the big data provider and compared their incidence to the estimated population incidence of denture wearers (based on online sources). Figure 1 illustrates the incidence rate for each rank compared to the population incidence.
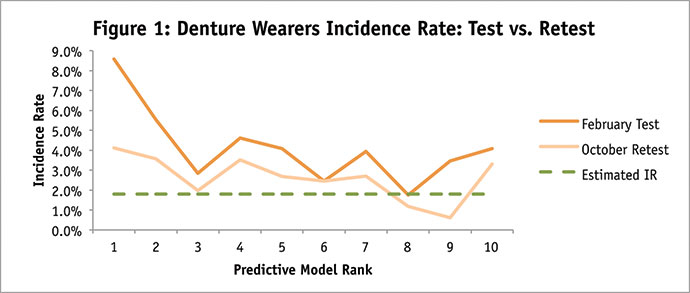
We made two observations. First, incidence rates were noticeably higher for ranks 1 and 2 in both tests, i.e., there were more denture wearers in those two rank groups versus the remainder, which is what one would predict. Ranks 3 and lower, however, did not consistently discriminate on incidence. In several cases, respondents from a lower rank had an equal or even better chance of qualifying for and completing the survey.
Second, there was substantial variability between test and retest. Even rank 1, the best rank, had an incidence rate of 8.6 percent in the February field but only 4.1 percent in the October retest.
The big data company did not provide actual probability estimates, either for each individual panelist or for their rank subgroups, so we had no idea what magnitude of incidence we might observe. We were simply told that people in rank 1 had the “best chance” of qualifying, whatever that might be. So it was possible that our panelists might all have been higher, or lower, on incidence of denture wearers, as compared to the population incidence. But the rank groups themselves should have at least shown a progressively lower incidence rate as the ranks decreased. And, given that we pulled respondents for the test and retest legs of the study from the same group of 122,000 panelists, we would also expect the incidence of each rank group to be roughly the same both times. Neither of these patterns was observed.
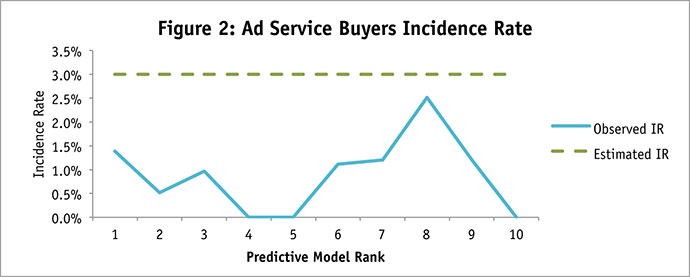
The findings for the ad service buyers study were worse. Again, while we did not know ahead of time whether our panelists would generally be higher or lower than population incidence, we did expect that the highest-ranked respondents would also have the highest incidence or highest percent qualifying for the study. But, as can be seen in Figure 2, the big data ranking variable added no value to the project. Here we looked at panelists from all 20 rank groups and found no relationship between incidence rate and rank.
Case study 3: Automobile purchase intenders
Product tested: Data enhancement
Sample design: 25-50-year-old Ipsos U.S. panelists
Target group: People intending to purchase or lease a new vehicle within the next 12 months
Total respondents screened: 7,571
Method
The same file of 122,000 U.S. panelists was also used as our base here. The big data company appended an “intend to purchase a vehicle” flag for each panelist. Panelists were given either a “yes” or blank value (if the big data company could not identify the panelist in their databases, the field was left blank). We then randomly selected panelists with this flag to take the survey and validate their eligibility; 2,173 people responded. As a comparison, we also invited a comparable random sample of panelists who were not submitted for data enhancement (i.e., not part of the 122,000); 5,398 responded.
Results
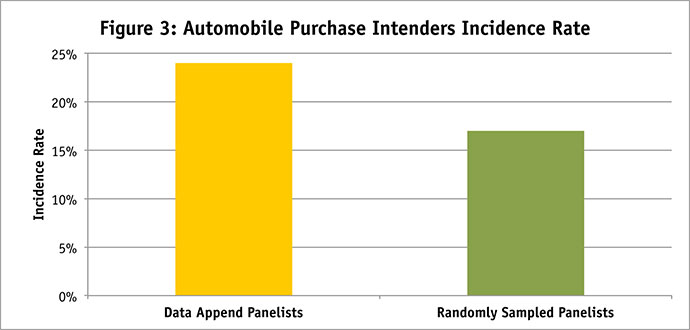
Figure 3 compares incidence rates between the panelists who were pre-identified as intending to purchase a vehicle and panelists who were not submitted to the big data company but simply chosen randomly from our panel. We found that the pre-identified “intend to purchase” group had an incidence rate of 24 percent, which was indeed higher than that of our random sample (17 percent).
Performed quite differently
The two big data products we tested – a predictive model and a data enhancement service – performed quite differently from each other.
In our tests, the predictive model performed poorly. Even the model’s highest-ranked candidates varied substantially in the percent who actually qualified for the study in question. In the dentures study, the incidence rate dropped to half its previous level on retesting, even though both test and retest legs came from the same pool of panelists who had all been ranked for their likelihood of wearing dentures. And for ad services buyers, the model was a complete failure, with no correlation between rank group and incidence.
Although we were not privy to the inner workings of the predictive model, we can imagine several potential sources of error that may have contributed to its poor performance in our tests.
- Low match rate. The big data company we used was not able to identify everyone on the basis of their name and postal address. In our dentures tests, the match rate was roughly 80 percent of the panelists we sent them. For the ad services study, we had a partial match rate of 26 percent, as the big data company only returned flags for individuals whom it located in their database AND who met the target criteria; it could not distinguish between non-target and non-matching individuals, which made it impossible to calculate an overall match rate.
- Data accuracy. Even when a person of interest had been positively identified in the company’s databases, the information itself may not be fresh. It is no secret that the accuracy of big data databases can be highly questionable.1,2 This makes sense: many databases such as government or financial records might only be updated once a year; other sources include “one-shot” databases that may not change at all beyond their initial creation (e.g., registration/sign-up databases).
- Model correlations. Any predictive model will naturally have some inaccuracy simply because the data do not perfectly correlate with what the model is trying to predict. For example, age and being a denture wearer are positively correlated but only to a degree; some 75-year-olds do not wear dentures, while some 55-year-olds do.
- Low incidence. In our tests we were looking to identify very hard-to-reach targets whose natural population incidence was less than 5 percent. It could be that such small incidence rates are beyond the ability of a predictive model to reliably identify, i.e., the statistical power simply isn’t great enough.
The data enhancement service produced better results. For the automobile purchase intenders study, a pre-existing purchase intent flag was appended to the list of panelists we submitted. Since this was self-report data (i.e., these people had themselves indicated intending to buy an automobile at some earlier point in time), not surprisingly it did a better job at identifying eligible respondents in the study versus a comparable random sample. For this product, our only wish was for greater transparency around the appended data; we did not know how old it was nor which people had been positively identified, yet had not indicated an intention to purchase.
On the basis of our testing, therefore, we see some limited upside to using big data services at the micro level. Yes, there’s a lot of individual-level data available in the public domain but the challenge of matching it on a case-by-case basis to specific individuals, and the age of the data itself, may reduce its accuracy to the point where it’s no longer useful.
REFERENCES
1 Avner, A. (2012, December 10). “The big data accuracy myth.” Retrieved from http://digiday.com/brands/the-big-data-accuracy-myth/.
2 Harford, T. (2014, March 28). “Big data: are we making a big mistake?” Retrieved from www.ft.com/cms/s/2/21a6e7d8-b479-11e3-a09a-00144feabdc0.html.