
Editor's note: Stephen Hellebusch is president of Hellebusch Research and Consulting.
I enjoyed the recent article by Steven Millman, “Stat tests: what they are, what they aren’t and how to use them” in the May/June 2021 issue of Quirk’s. As I read, I mostly agreed and a few other thoughts came to mind.
The first was just a difference from my experience in the use of terminology. For me, the p-values represent significance levels and are the reverse of confidence levels. So, a significance level of p < .05 is exactly the same thing as a confidence level of 95%. For Millman, the p-value is .95 when the confidence level is 95%. For me, the 95% confidence level is 1-.05, the sharp line p-value. Both make sense; they are just different ways to say the same thing. Scientific writing will always couch results in the p-value method, usually showing the exact value, e.g., p = 0.002 and declaring whether or not statistical significance is achieved.
•••
Another way to think about the logic of statistical testing for differences is that it is “backwards.” Using two percentages from different groups of people (e.g., males, females, brand awareness), you first assume that the percentages are not different (the null hypothesis). If testing tells you the odds are less than x% that they really are the same, not different, you can reject the idea that they are the same. Then you can declare them “statistically significantly different at the (1-x)% confidence level.”
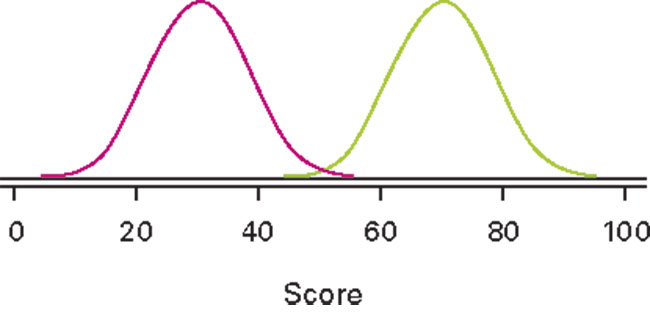
What’s actually going on is trying to determine whether or not two means or percentages are from the same population distribution or not. Assume that they are. If they are, then the test statistic, e.g., a Z-value or Student t value, will be a number that could easily come from the same distribution – the equivalent of between 20 and 40 on the accompanying graph. If they are not, it will be bigger – further out on the scale – say, between 50 and 80, much less likely to have come from that common distribution. We are “playing the odds.”
•••
An excellent chemistry teacher once used various little tricks to engage the class’s interest. He would state various (sometimes boring) facts and then yell “SO WHAT?!” That woke us up! Then he’d explain what those facts meant, relative to whatever topic he was teaching. As pointed out in Millman’s article, base sizes act as magnifying glasses, making statistical significance easier to achieve. In marketing research, we have conventions for “reasonable” base sizes in the hundreds or thousands. But I once saw an experienced professional get very excited because a 0.1% difference between two percentages was “statistically significantly different at the 95% confidence level.” Both base sizes were in the tens of thousands, provided by a syndicated service. As in the case of the 0.1% difference, sometimes statistical significance and substantive or meaningful significance are two very different things! When looking at insights, it’s not a bad idea to ask, “so what?”
•••
Using the wrong test also struck a nerve. I wrote a short piece (“Ordered up wrong,” Quirk’s, February, 2006) that noted how the wrong test can lead to different conclusions than the correct one. One pet peeve is the reliance on survey programs that test all possible pairs in situations where there are more than two groups (usually, subgroups). The chi-square is designed to take all the information into account and test percentages across three or more groups; the Z test between proportions, which is what the survey programs often use, is not.
Another common error, based the convenience provided by data tabulation programs, is to test every row of a scale. For example, if a five-point purchase intent scale is used, the statistically correct procedure is to pick one (count it: ONE!) appropriate summary statistic (e.g., means, top-box percentages, top-two box) and use that to test whether groups differ. Testing every row of the scale between two groups violates a host of assumptions behind the testing, since no one row is independent of the others. The top-two box percentages dictate the percentage left that can be in the rest of the scale. Nevertheless, the survey data tables cheerfully proceed to test every row, generating a lot of meaningless “information.”
Hopefully, insights based on erroneous statistical testing are a minor finding in otherwise sound marketing research!