Your results may vary
Editor's note: Steve Gittelman is president, and Elaine Trimarchi is executive vice president, of Sample Solutions, an East Islip, N.Y., research firm.
Researchers must know if the changes they see in their data are real or artifacts of an inconsistent sample frame. The quality of respondents as measured by their levels of engagement is hypothesized to be correlated with the consistency of data obtained from commercial online panels around the world. To that end, identical tracking studies were conducted among 21 panel companies in 13 countries, represented by 10 companies and a total of 22 panels. A correlation was found to exist between respondent disengagement and the inability of a panel to generate replicable, consistent data using the same survey vehicle.
Consistency of online samples has become a core issue for market researchers. After all, much of the value we provide is in the tracking studies we perform, but even one-time studies should relate to some reference and not float in a sea of variability between panels. If your data changes, it is essential to know if the changes are real or the inadvertent product of sample inconsistency.
In the past, we had no reason to fret over sample consistency. At the core of every research career there is a fundamental reliance on probability. Toss a coin, any coin. It will reliably come up half heads and half tails. There is no magic in it; in the coin toss exercise we are matching to known characteristics.
No one would expect to toss a coin a million times in order to prove its “fairness.” Market researchers have drawn samples from known commodities for decades always relying on the fairness of a coin toss. Households could reliably be reached by telephone almost 99 percent of the time and the small fraction of non-phone homes mattered little. Yes, we had to adhere to strict calling regimens, callbacks, refusal conversions and most of all recovering a large percentage of the sample. The key here is that the telephone sample replicated the census because it reached most segments of the population with equal penetration and theoretically equal probability. We knew the composition of the population in advance and could rely on that reference to keep our samples targeted. It was reliable, predictable and repeatable and thus consistent; it earned its name: probability sample.
Began to crumble
As refusal rates began to climb and do-not-call lists became good politics, the ability to reach some segments of the population dwindled. The all-important concept of a high recovery rate began to crumble. Phone, with an increasing percentage of line-cutters and cell phone users, had begun to wane, as its ability to replicate the census was impaired.
Why worry about the census now? Where once research was well-grounded in a probabilistic framework supported by an underlying census of the population, online market research has moved into a new era, from a probabilistic framework to “working without a net.” In the absence of a probabilistic method to anchor samples, non-probabilistic samples can drift without our knowing.
One now-historic example of this happening was presented by Ron Gailey (IIR 2008), now of Coca-Cola, previously of Washington Mutual (WaMu), who disclosed how 29 studies representing 40,000 online interviews had gone astray due to panel inconsistency. In the WaMu research, the change was due to shifts in respondent tenure that resulted from changes in the panel’s constituents over the two-year span of the base research. Gailey’s research showed a 30 percent drop in buyer demand for WaMu’s financial products; a result (2006-7) unsupported by sales. His conclusion, after much study, was that long-term panel members were less optimistic about their purchases than new panel members. Others have since corroborated this finding. The lingering question, now that WaMu is gone, is how the tainted research impacted critical business decisions.
The effects of hyperactive respondents and other online respondent ills were brushed under the rug. Gailey unknowingly had to use a sample that showed aging affects that took time to evolve.
Gailey had to do a lot of digging to find the root problem within his data. If online samples changed as they aged, then they could not be counted on to provide reliable data through time. And there are a host of factors that could change them. For example, mergers bring together samples of different sourcing and aging profiles. Management makes decisions influencing the frequency of hyperactive respondents by increasing the number of surveys that they are invited to and allowed to complete. It is evident that a panel that is used many times a month is different from one that has new respondents all the time. Panels differ for a wide variety of reasons, many of which are not disclosed to clients since currently there are no standards.
Luckily, there is a world out there of science that has long ago learned to collect data and make decisions based upon sampling frames that are non-probabilistic. When Charles Darwin hauled himself onto the volcanic shores of the Galapagos Islands he took samples of as many islands as he could reach. For the most part, these isolated little islands were different from one another. Even birds that could theoretically fly from one to the next differed. He didn’t have a census to draw his conclusions: He was the census!
Darwin took samples of a few islands and wrote a pretty good book. The samples were not grounded in probability theory and he could not generalize from island to island. Vive la difference! It was the differences that gave him clues. Each island was an ecosystem unto itself and the differences that species on the islands had to endure shaped them into the specialists that they became.
Our use of online data has much to learn from island biogeography. Think of each online panel as an island. They have similarities but are drawn from different sources. We should not expect them to be identical; we should expect them to be different. Our research has shown them to be quite inconsistent (Gittelman and Trimarchi, February 2009 CASRO) and the ARF supports this point. The panels are not interchangeable. The online panels are drawn from different sources, are subject to differing management practices and for a host of reasons yield different results.
Hidden in all of this is the concept of sample consistency. After all, if we measure bias and can’t anticipate its shifts over time, then we will not understand which changes are coming from our data or from background noise in the sample. Thus, the ARF announced in June 2009 that the issue of consistency was its most important area of concern. We must learn to measure not only what the constituent elements of our data sources are but also how they change over time. In other words, we have to enter a new world of replicable methods for consistency analysis.
As we do our research, we must know what the changes in our data mean. Are they the product of shifts in opinions or changes in the sampling frame? To get a grip on this we need parallel studies that document the consistency of our samples.
A complex concept
Consistency is a complex concept. We need to know the differences between panels at any given moment so that we can understand how the panel we use changes through time and events, confidently switch to a different panel or use multiple panels in our research. Blending samples is a good way of spreading risk among many to avoid the potential ills of just one. Be prepared for the use of sample blending techniques to become an industry standard for achieving consistency around the globe.
We have moved onward from our initial tracking study of the American markets (Gittelman and Trimarchi, 2009) and have expanded our research to include over 200 panels in 35 nations. In each, a standard translated instrument was used that included a diversity of measures but mostly focused on buying behavior segmentations. By conducting repeated waves of this consistency tracking study, a local grand mean was calculated for each market (for more on the grand mean project, visit www.quirks.com/articles/2009/20091107.aspx). In addition, using standard quality-control techniques, an analysis of the consistency of each panel was conducted.
It is quite predictable that buying behavior will shift on a seasonal basis. It is also predictable that the ice will melt in spring and that the rains will come. We bet on it all the time. They say that the only things that you can count on are death and taxes – wrong! Predictability is as much a part of consistency as is reliability. Consistency does not mean staying the same but rather having predictable patterns of change. The U.S. census did not provide us with that.
If all panels were required by their users to show that they were consistent, we would have both a measure of quality in their samples as well as a new set of indices to replace the absence of a usable online census. Certainly, if all panels provided data on how their members responded to a battery of purchasing questions and the segmentations were tracked, Ron Gailey would have had a reference to consider when his panel’s composition began to change. The census has very little relationship to the online community and even less to the online community that participates in panels. The offline population is different from those online and the panels themselves are a disparate group with almost no guiding standards. The whole process of belonging to a panel filters out an unknown sector of the population and no one knows how to weight them or what problematic and unweightable variables might be hidden in the data.
We test panels regularly for consistency: each participates in at least three waves of audit separated by a minimum of three months. This provides end users with assurances regarding the stability of panel output.
In this article, we summarize the results of consistency analysis conducted in 13 countries: Australia, Brazil, Canada, China, France, Germany, India, Italy, Netherlands, Russia, Spain, United Kingdom and the United States. A total of 10 panel companies contributed to the effort.
Inconsistent data is either the product of real changes in the underlying phenomena that are being measured or driven by the data collection method. The former is clearly not a problem while the latter clearly is.
Here we use demographically balanced populations (age, gender, income) from wave to wave, an identical questionnaire instrument and track data changes within a single panel. We use two methods of data collection, one where the cooperating panel is informed of our efforts and the second where the sample source is blind.
We divide our target countries into those where online penetration is high and online research is well-established and those where online penetration is low and online research is a relatively new endeavor.
The identity of participating companies has been kept confidential.
Methods
Question types
Analysis was based on response to questions on three types of information:
-
Demographics (including age, income, education and marital status distribution) reflect the traditional classification of respondents. Note that some of these variables were used to quota-control the sample. As such, they measure the consistency of the quota process.
-
Structural segments (based on buyer behavior, sociographic issues and media use) reflect the cultural, social and behavioral characteristics of the respondents. These segmentation schemes may vary between countries and regions. They should be more consistent within countries and within panels over time.
-
Source performance (including erroneous, professional and satisficing behavior metrics) may reflect the quality of survey results. These include the issues of incorrect responses, speeding through the survey and frequently participating in surveys.
Two references are used to gauge the consistency of results: overall average response within source (local mean) and the external grand mean representing the average responses for a standard questionnaire over a number of sources. The grand mean references have been collected by country and are used only within the country to evaluate panels.
Consistency is evaluated as a comparison with the average values for a given panel across all waves of the consistency analysis. Large deviations from the average are labeled as inconsistencies. The grand mean exists purely as a point of reference to our estimate of a country’s “actual” population value. The reliability of this estimate varies according to the amount of data and diversity of sources collected within that country.
References and error bounds
The internal reference for analysis is based on a moving average of the data series. As more data in the series is available, the average reference values are expected to become increasingly stable. All variations are assumed to be associated only with the tested panel. References are treated as population values, with no error bounds. Eliminating this source of error results in a decrease in the error bound, making this analysis somewhat more conservative.
Distribution metrics
Differences between values within the data are tested and depicted using the following methods:
Variation and error. Stacked bar charts are used to show the time series results of the sample set along with the appropriate references. Error bounds at two standard errors around the components are also shown to illustrate relative importance of differences. As previously noted, all error is assumed to be associated with the panels being examined.
Distance measure of variation. The root-mean-square distance measure is used to indicate the degree of separation between two samples. (The root-mean-square distance is defined as the square root of the average of square of the differences between the distributions elements.) In a broad sense, it can be approximated as the “average” percent deviation from the panel average on a given metric.
Behavioral segment distributions
Typically, panels and lists are filtered to balance demographics against some external standard such as the known general population. However, demographics do not account for every attribute of importance to market researchers. In an attempt to account for the behavioral attributes of respondents as well, we introduced three segmentation schemes, determined through cluster analysis on an array of 62 consumer behavioral variables.
Three segmentation schemes are being used in this evaluation, focusing on 1) buyer behavior, 2) sociographic factors and 3) media use factors.
Buyer behavior segments
The buyer behavior segments are intended to capture the variability in the attitudes and actions regarding the purchase of a broad range of products. The standardized profiles for the selected U.S. sources are shown below and reflect the response to 37 input variables.
The titles of the segments reflect the strongest loading variables making up the segment. The purpose of this scheme is to reflect differences between sources of data and the general grand mean representing that region. The distribution of these segments can vary widely between different countries and global regions. These are expected cultural variations. However, we expect the distribution of these segments among panel and sources of data within regions to be less variable. Furthermore, the distribution of segments should be consistent over time within a panel or source, assuming sampling methods remain constant.
Source performance metrics
Aside from the behavioral profiles of our respondents, their survey-taking behaviors are also of interest to us. These extend to questions of both quality (or engagement) and of hyperactivity.
Hyperactivity. Hyperactivity reflects the frequency of survey-taking by the participants in the panels. In general, these focus on issues and concerns with the long-term maintenance and in particular the tendency to contain professional participants. These metrics may include participants who belong to multiple panels, have been on panels for an extended period of time or who take surveys frequently.
Trap questions. The incidence of errors in the execution of questionnaires reflects the quality of the panel. These are checks designed into the testing instrument. They include but are not limited to inconsistency in responding to multiple questions and the failure to follow instructions.
Satisficing. Some respondents can exhibit behaviors that put their responses in doubt without failing trap questions. These include: 1) speeders, who finish their questionnaire in an extraordinarily short time and 2) straightliners, who tend to give the same answer to a large number of questions. These are not errors, just extreme behavior that provides a warning of potential problems.
Hyperactivity (frequent survey-takers)
A concern regarding online panels is the development of professional survey takers. These are members of the panel or data sources that are frequent survey-takers. The frequency of professionals is estimated in terms of four measures: 1) belonging to five or more panels, 2) taking surveys almost every day, 3) having taken at least 30 surveys in the past month and 4) panel tenure. All of these are self assessments and as such may be in error but they represent consistent metrics.
Satisficing behavior (speeders and straightliners)
Because of the nature of online surveys, participants may delay execution and thereby run up huge apparent elapsed times. Typically these long times are removed for analysis. Speeders are those who finish the questionnaire very fast. Generally for our test instrument that is less than an overall lower 10 percentile.
Similarly, straightliners are defined based on the lack of variation in their responses. For the purposes of analysis, the standard deviation over a range of similar questions is used to estimate variation. Straightliners are defined for this analysis as respondents with a selected standard deviation of one unit (out of seven) or less for 30 questions.
Q-metrics
The quality segments are based on the number of faults recorded on the above metrics including errors, professional behavior or satisficing. There are six indicators in this estimation: three performance measures, one measure of professionalism and the two measures of satisficing behavior. Four segments are used corresponding to: 1) no error, 2) one error, 3) two errors and 4) three or more errors. In this context, it is the third and fourth segment which are of the greatest concern since they represent those who are most likely to give erroneous responses.
Results
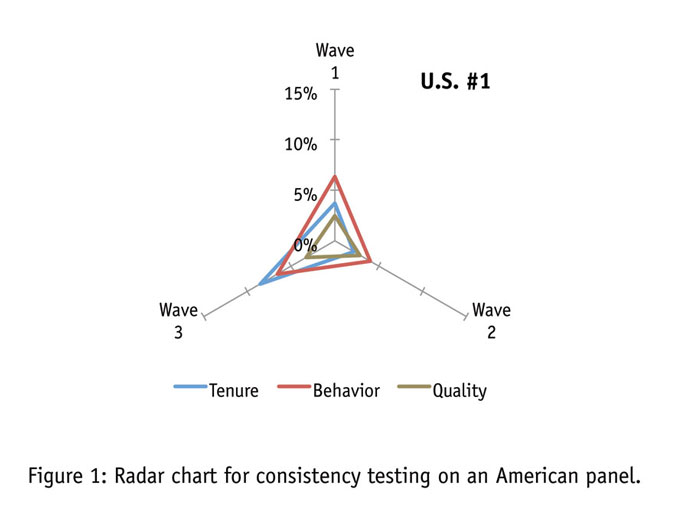
Figure 1 displays panel consistency for an American panel, which by our measures proved to be fairly inconsistent. The radar chart tracks changes in our behavioral segmentations in panel tenure and in quality metrics from the panel’s overall average across the multiple waves of profiling. The behavioral segmentations (shown in red) showed significant variability, particularly in waves one and three, as indicated by deviations from the average (the origin). These shifts were accompanied by changes in the panel tenure of the respondents used (shown in blue). The engagement levels of the respondents, as indicated by our QMetrics scale, remained consistent throughout (shown in olive).

Figure 2 indicates the results of other consistency tests we have undertaken in the U.S. Across six more panels, we are generally quite pleased with the level of consistency we have seen. In those cases where there are inconsistencies, however, the relative congruity of the deviations makes it quite clear that changes in one’s data do not occur at random. Shifts in the behavioral profile of a panel are almost accompanied by a change in overall respondent quality, a change in respondents’ panel tenure or both. The relative congruity of these changes is striking.
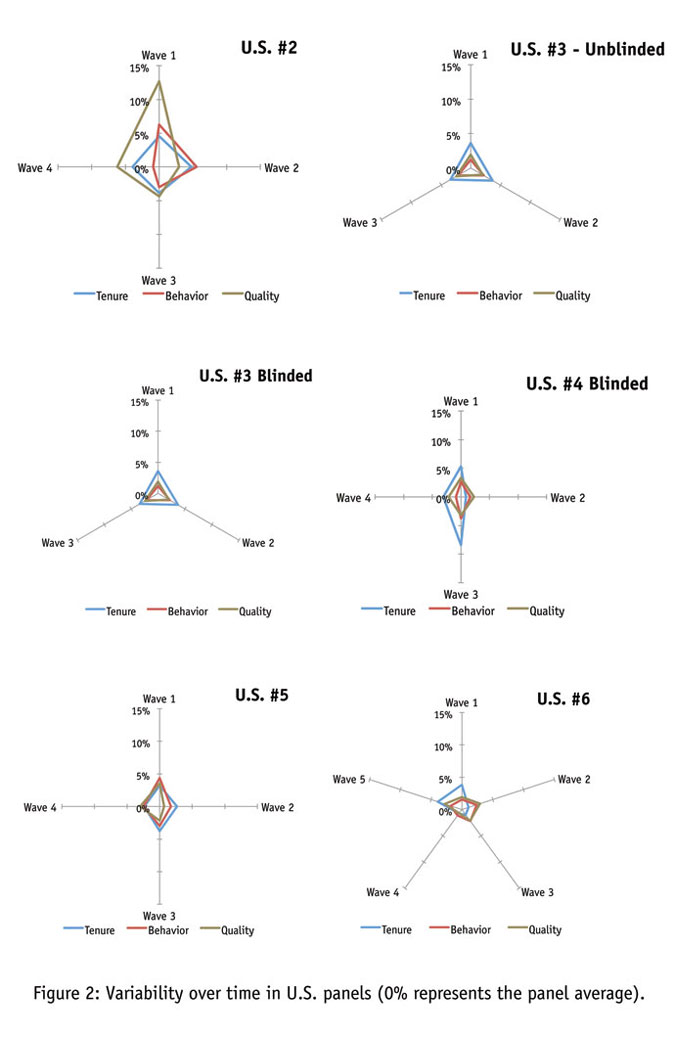
Another finding that we feel validates our method is the relative similarity of blinded and unblinded results. If panel companies were manipulating their sample so as to pass our consistency testing, we would expect to see a vast difference between data when the panels knew we were testing and when they did not. As it is, the results seem very comparable in either case, indicating a good-faith effort on the part of the panel companies to represent themselves accurately.
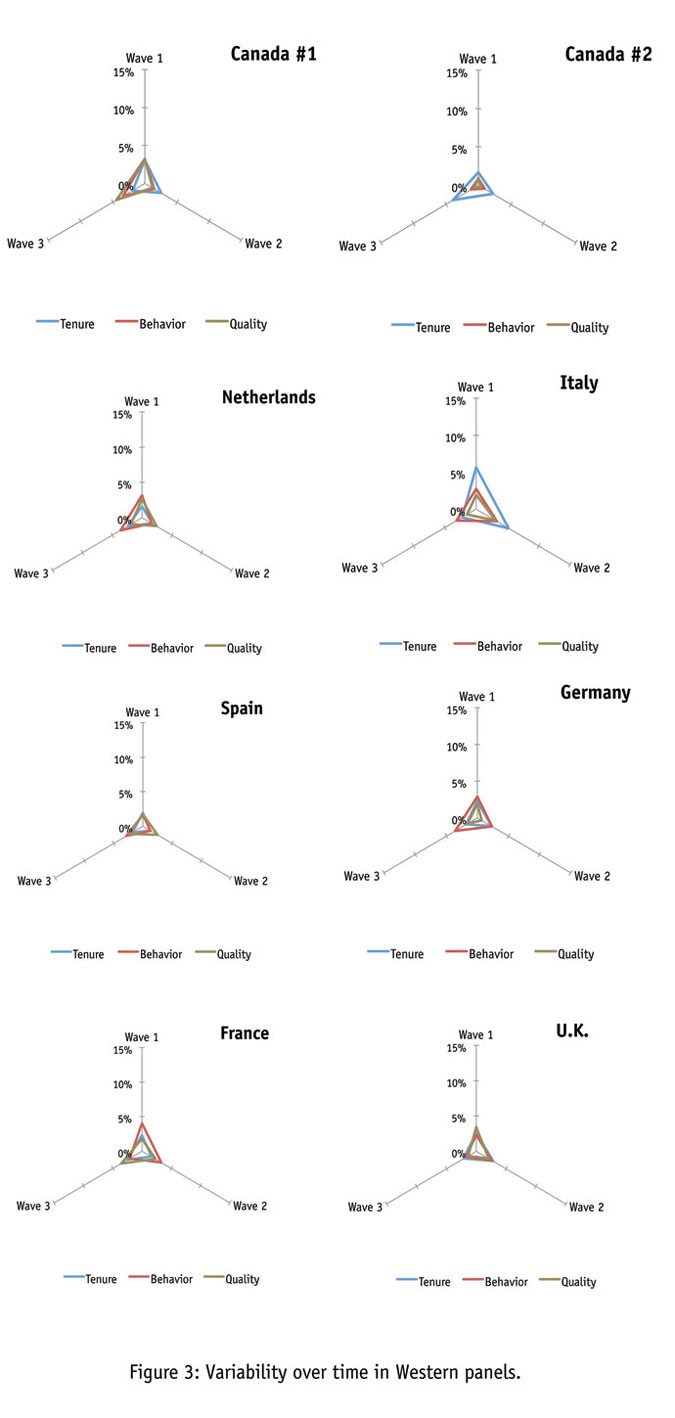
Now let’s take a look at consistency in other Western panels. Though there are some hints of variability here and there, by and large it seems apparent that panel companies can achieve a consistent sample in most developed nations. Here the relatively low levels of unengaged respondents, coupled with stable sourcing, generate a picture of consistency (Figure 3).
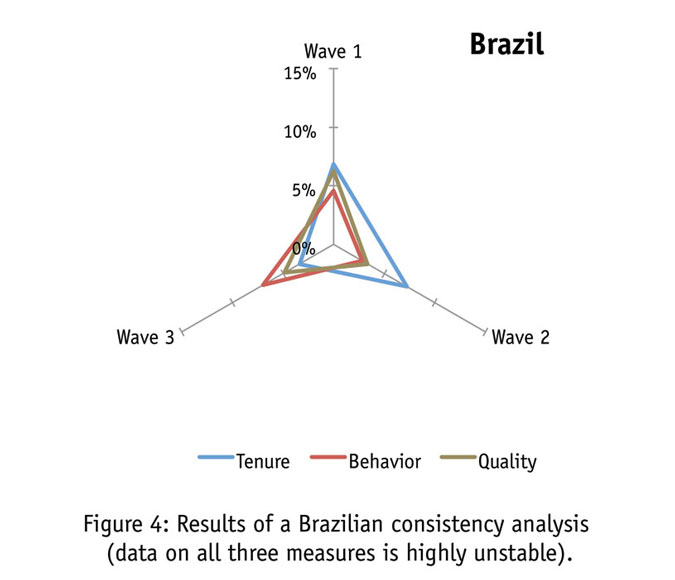
The BRIC countries (Brazil, Russia, India and China) represent a significant challenge to market research data collection firms. Although this Brazilian panel (Figure 4) appears to have begun the analysis with highly-engaged respondents, the two lowest-quality segments of respondents are rapidly growing. Concurrently there appears to be an inherent instability in the behavioral segmentations. We do not believe that this change is reflected in the population as a whole. These data indicate an increasingly unengaged population within the panel that is behaviorally in flux. This is likely to be due to a combination of increased respondent tenure coupled with the introduction of new sources. One would have to use extreme caution in launching studies with this panel.
Looking at Figures 5 and 6, we find Russian panels to consist of highly engaged respondents. As the number of waves in a consistency analysis increases, it becomes harder to stay within the decreasing error bound. On the standards of analysis with fewer waves of testing, this panel is relatively stable.
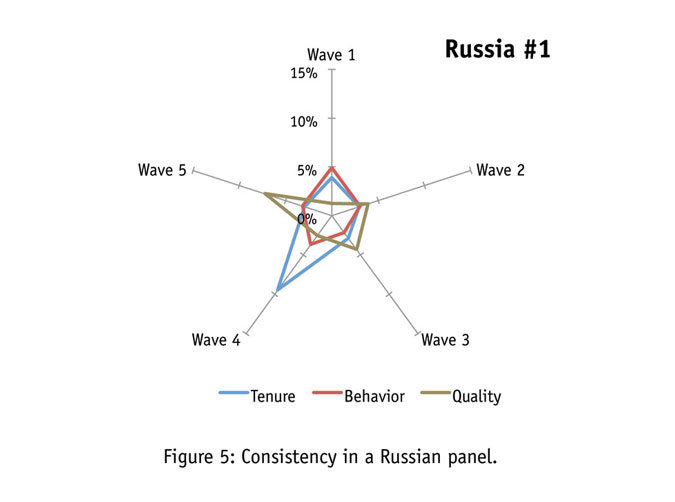
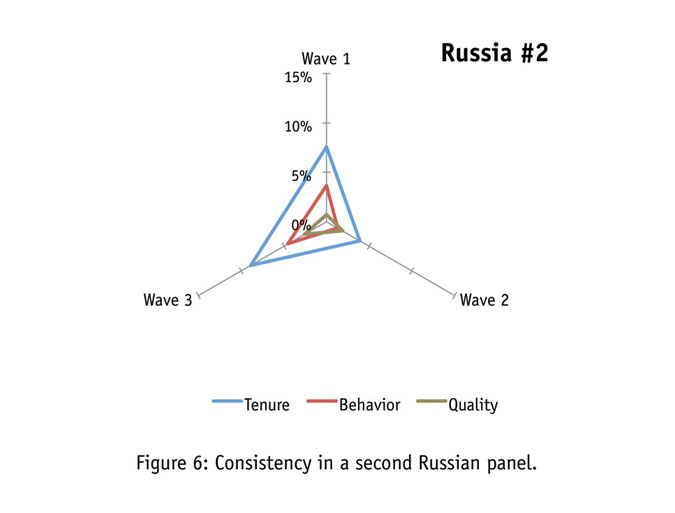
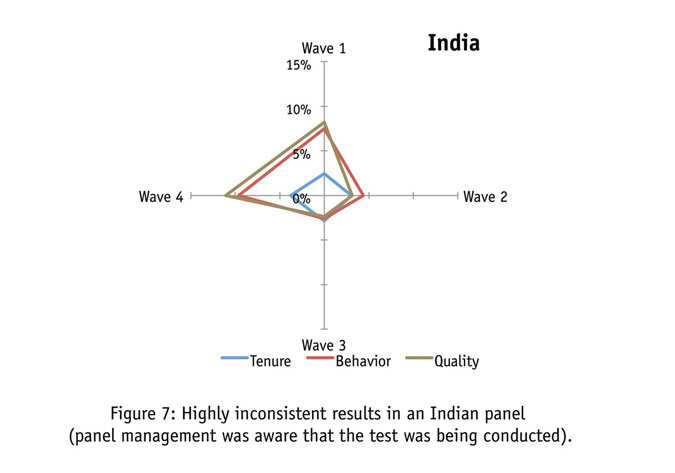
Figure 7 shows that no country thus far confronts us with greater inconsistency than does in India. In this case, the participating panel made every effort to stabilize the data from wave to wave. But it’s quite evident consistency was seemingly unobtainable. We doubt this was the product of management inattentiveness as seemingly every piece of sample was scrutinized.
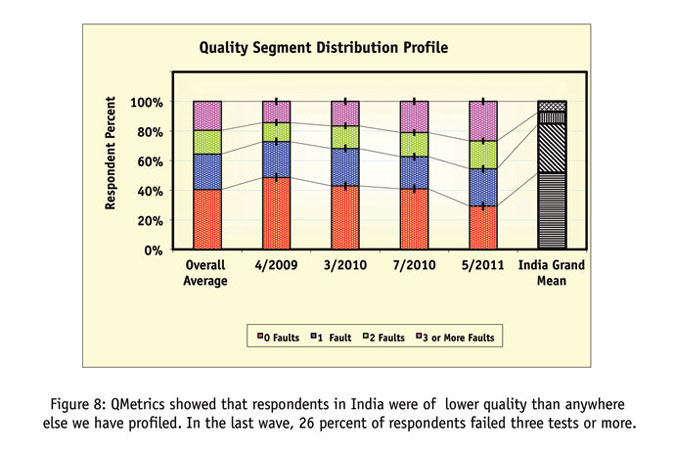
Next we draw your attention to Figure 8's QMetric scores, where we experience massive inconsistencies in quality ratings, as well as high numbers of disengaged respondents. Under these circumstances, the data flow is unlikely to be stable and the panel source should have considerable difficulty in passing the hurdle of a consistency test – as is proven by the distortions in the behavioral distribution. The congruity between the inconsistencies in behavior and in quality is strikingly close.
If data instability approaches an almost random condition, the data obtained is useless if not dangerous for research practitioners to use.
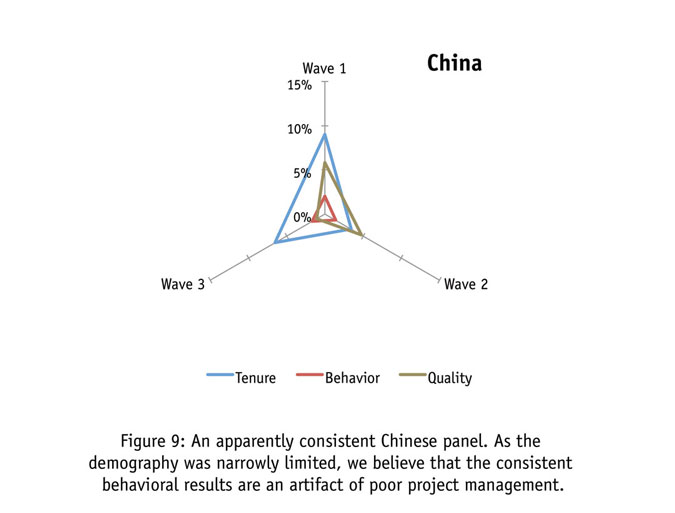
Our hypothesis states that behavioral variability will likely result from changing quality and panel tenure. However, as can be seen in Figure 9, the case of China seems to be an exception to our rule. In our Chinese consistency test, the participating panel was unable to meet the age, income and gender quotas that we normally require. By restricting the demography, they in turn reduced the potential for variability. This may be why their data appears consistent despite high instability in tenure and somewhat high variability in quality.
Vary drastically
Respondent engagement is an important component of respondent quality. All respondents across these studies were administered identical translated questionnaires and yet levels of engagement vary drastically across panels. The causes of these differences are myriad and best explored elsewhere (see our article in the December Quirk’s) but perhaps the consequences are in question.
The importance of a consistent sample frame is easily grasped – a panel company must be able to provide consistent results to questions with stable population values or else changes in more dynamic variables will be difficult to interpret. In the pursuit of consistency, disengagement plays a vital role. If respondents are answering in any way randomly it is extremely unlikely their responses will be useful or replicable. Since this error is theoretically random and not systematic, it may not necessarily cause changes in overall means. But this error can manifest itself in fluctuations that could easily be misinterpreted as meaningful. In essence, researchers must know if the changes they see in their data are real or artifacts of an inconsistent sample frame.
References
Gailey, Ron. 2008. “The quest for sample integrity: exploring panel sample characteristics that impact survey results.” Presentation at The Research Industry Summit: Solutions that Deliver Quality, IIR, Chicago, November 2008.
Gittelman, Steven and Elaine Trimarchi. 2009. “On the road to clarity: differences in sample sources.” CASRO Panel Conference. New Orleans. 2009.
Walker, Robert, Raymond Pettit, and Joel Rubinson. 2009. “A special report from the Advertising Research Foundation: The Foundations of Quality Initiative, a five-part immersion into the quality of online research.” Journal of Advertising Research 49: 464-485.