Getting the lay of the land
Editor's note: Steven Struhl is principal at Converge Analytic, a Moorestown, N.J., analytics firm. He is the author of the upcoming Artificial Intelligence Marketing and Predicting Consumer Choice (Kogan Page).
In last month’s article (“Patterns and relationships”), we discussed the important first steps in analyzing text. These include removing common words, known as stop words, that carry little semantic meaning. Another key step is correcting misspellings and making the tenses and endings of words uniform, so that variations of the same word do not get counted separately. This is called stemming. Some programs go further and try to determine the part of speech of a word – for instance, determining whether a word like “wax” is a noun or a verb. This process is known as lemmatization.
Finally, some programs go further and look for combinations of words that belong together, such as “not bad” or for names that need to be treated as a single item, such as “Iron Mountain Brewery.” This last activity is called finding named entities.
Sometimes this whole process is called tokenization. These tokens are what the computer processes.
We reviewed how text gets into analyzable form. Most commonly one of two models would be used. First, the word-vector model treats each block of text being analyzed, or document, as one row in a spreadsheet. The words appearing in the document (that have been stemmed and minus the common stop words) define the columns. The other method, the sequential model, looks for words that appear near each other, within a certain predefined number of words, within a document.
We also discussed how text can be used in a predictive model. These involve a target or dependent variable, typically something outside the blocks of text, such as an overall rating, or a behavior, like renewing an account. These methods can provide powerful insights that help direct tactics.
Descriptive analytics show broader patterns. Predictive analytics are more like a map that get you to a destination. Descriptive analytics are more like a landscape, showing broad contours and features. This month’s article reviews some of the applications of the descriptive methods. Of the two alternative approaches, the descriptive ones appear to get far more use.
Cleans up the words
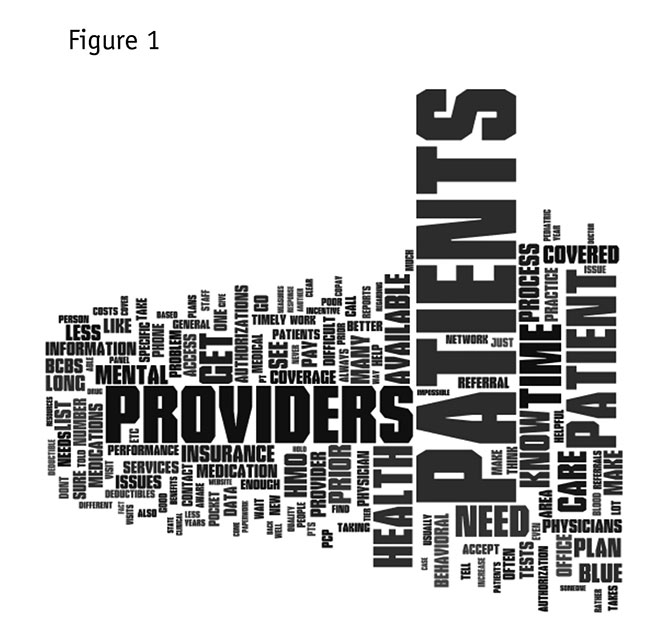
First and most familiar, we have the basic word cloud, or wordle. There actually is no analysis here, just counting, although the computer does work fast and furiously to put the words into place. Basically, this diagram just cleans up the words, counts them and makes the most prevalent ones the largest, packing everything into a compact space. You may see the words packed into a rectangle, but in Figure 1, we have an arrangement that looks something like an ailing grand piano. This comes from a study about health insurance and summarizes the main themes in hundreds of comments about what is on the minds of doctor’s office managers. You can see that patients are foremost on their minds, followed closely by providers (or insurers). You can also see that the program doing the analysis was fooled by a plural form and both “patient” and “patients” are among the words it tallied.

This is a baseline analysis for images that show relationships among words. Word clustering creates a diagram where words that appear together most in the document or documents are closest.
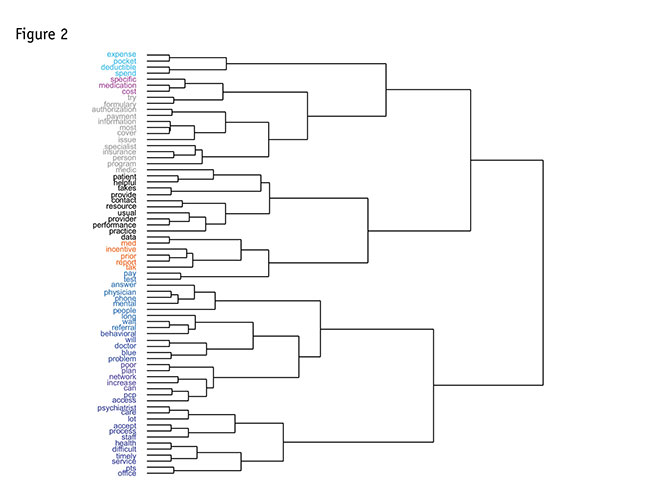
The lengths of lines in the diagram correspond to how related the words were to each other – shorter distance is more related. This uses a standard clustering method, called Ward’s method. This has a number of technical properties that make it work well with text. (We will skip those for now, thankfully.) The diagram in Figure 2 comes from another study about health insurance and reflects hundreds of verbatim comments about what could be improved. The words fall into 10 groups, which have been color-coded so that you can see what is most similar. If you read very carefully, you can see relationships. Figure 3 is a small portion of the diagram, expanded so you can see it more easily.
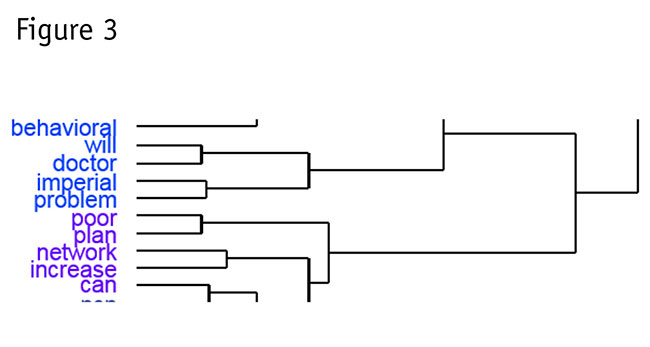
It this excerpt, you can see the words most associated with “problem.” These include: imperial, the disguised name of the insurance provider; doctor; plan; network; increase; and behavioral (which means getting psychiatric services, now called “behavioral medicine” for strange reasons). These indeed do sum up the central problems of the poor office manager’s life.
This type of word cloud is a spatial diagram showing how often words occur near each other. It builds on the word clustering we just saw, using a technique called multidimensional scaling (MDS) to create a layout of the co-occurrences of words within the sliding n-gram window. Bigger words are more frequent, words that occur together are closest and the colors represent the clusters that we found earlier.
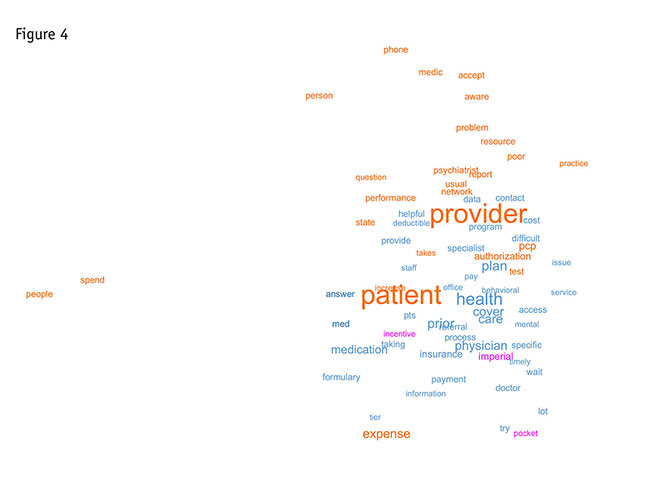
The diagram in Figure 4 is from a similar insurance study where the words fell into just three groups. Note that words from different clusters can appear together in this diagram because it is attempting to collapse the many-dimensional space that the multidimensional scaling found into the two dimensions possible when we portray a diagram on paper. We can think of this as something like the shadows cast by a three-dimensional object on a flat surface, except that there are more than three dimensions.
If words are colored differently and they appear right near each other, they likely are not quite as similar as the diagram suggests. We can see clearly that providers and patients again are most important – and that they definitely fall into the same group. Note that the insurer, disguised again as Imperial, is in the same group as incentive and pocket (as in “out of pocket”) and nothing else. This by itself tells us something.
Help delineate groupings
We can do many similar diagrams. We can draw covers or boundaries around the groups of words, which may help delineate groupings. We can make graph layouts of the words, which draw connectors, so that we can see which words are most connected to others. Words with a lot of connections have a high degree or a high amount of centrality – and so are important concepts. These other charts are largely variations on a theme, highlighting different aspects of connections among words. Typically, it is best to generate all of these and select the one or ones that most strongly convey the patterns in the text you are analyzing. (You can see these variations in the book Practical Text Analytics.)
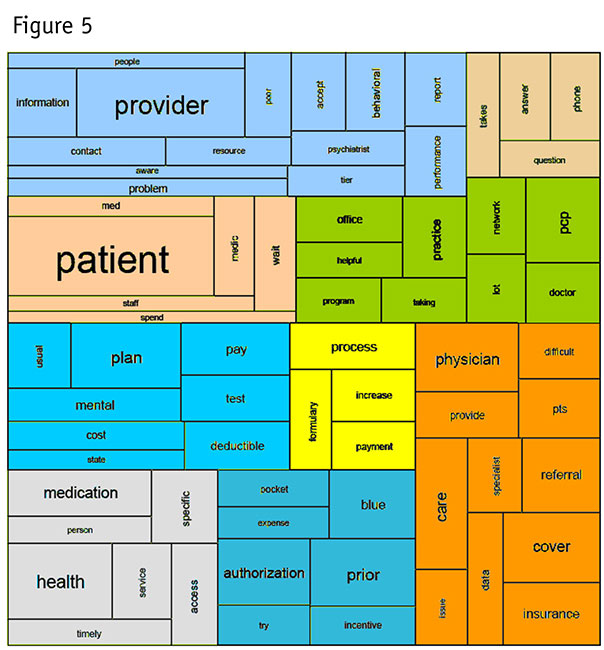
Not all treemaps are alike. As we mentioned earlier, the wordle is a type of conventional treemap that does not order the rectangles statistically. It simply packed words as closely as possible and sized them according to frequency. In the map in Figure 5, words are grouped so that similar words occur together. The sizes of the words and their surrounding rectangles also are proportional to their frequencies in the documents. Colors are based on the cluster analysis. Overlaying the clustering colors helps us check whether we have a sensible arrangement. If regions of rectangles are solidly one color, that increases our confidence that the cluster analysis found coherent patterns. In Figure 5, we can see this outcome – and groups that make sense.
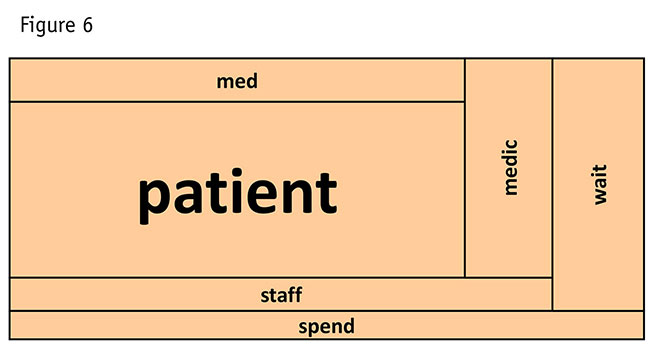
If we look just at the section of the diagram surrounding one of the major themes, patient, we can see other highly related ideas (Figure 6). Wait is a key related concept, along with medication (captured in two ways as the stemmed word medic and as the common abbreviation, med). Other less-important concerns related to patients are staff and spend.
Overall, because it clearly shows groupings and the frequencies of words, this is a highly informational diagram. It is one of the best qualitative displays of the concerns expressed in a body of text and how they relate to each other.
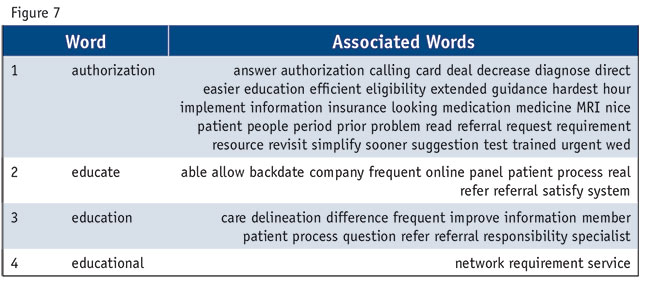
Around the year 2000, finding words near a key word was the height of text analysis. In a really fancy program, you could pick out a word and all the other words that occurred around it would be reported. This of course is another kind of counting exercise. It gives a view of how many ideas link to each word and so gives a sense of whether the word connects to many other ideas. Many associated words show a word that is fundamental to the document. Figure 7 shows the words most closely associated with four specific key words in the same insurance study. Authorization (getting paid by the insurance company) is clearly more central than education in any of its forms.
Two broad approaches
In this article and the one last month, we have shown a sampling of methods falling into each of these two broad approaches, the predictive and the descriptive. We aimed to give a sense of the different views they provide of what happens in a block of text, whether we are looking at hundreds or thousands of gathered verbatim responses or a complete document such as a book or a movie script.
Predictive approaches seek to find the words or combinations of words that forecast or explain patterns in a dependent variable, such as share of spending or overall rating. To get these powerful methods to work, you must have information other than the text itself – you must know something else about those who made the comments, whether it is a rating, an intention or a behavior.
Descriptive methods give more of an overall feeling or a lay of the land. While qualitative in nature, these can enhance understanding of themes and ideas in the text. Most text analyses appear to fall under this heading. They do not provide insights about whether the commentary is related to something that happens, whether it is an overall rating, intention or behavior.
The pictures and patterns revealed by descriptive methods can be highly engaging and help get discussions started. Still, when we do these analyses there is a key question: Are these supplemental or sufficient? That is what we need to decide.