Patterns and relationships
Editor's note: Steven Struhl is principal at Converge Analytic, a Moorestown, N.J., analytics firm. He is the author of the upcoming Artificial Intelligence Marketing and Predicting Consumer Choice (Kogan Page).
Text analytics is a vast field reaching into many areas. These range from understanding how words are connected to training computers to grasp meanings. This discussion will talk about two broad subfields:
Predictive or model-based analytics. In this, text becomes a set of predictor variables used in a model. Models must have a target variable such as, for instance, overall ratings, clicks on a Web page, use levels or purchases. This form of analysis is quantitative. This is the focus of this month’s article.
Descriptive or enumerative analytics. These appear to be the most common types of text analytics. These look for frequencies of word groups, associations of words, proximities of words and so on. Some of these lead to various pictorial representations of patterns in words, including the word cloud or wordle, which in popular usage seems to stand for all of text analytics. We will meet up with the descriptive methods next month, in the second part of this article.
We will be skipping over a number of subfields, salient among them is sentiment analysis, which seeks to give an overall measure of the emotional tone of many comments. Positive and negative words and phrases are counted and a sentiment score is derived.
Sentiment analysis can involve fiendishly difficult tasks for the computer but when the results get to the user, they are largely a counting of which words and phrases appear. This often gets done through the computer searching dictionaries of positive and negative words and counting words appearing in each. More complex approaches untangle subtle patterns using complex algorithms.
We also will be skipping the vast arena of semantic analysis, which looks for complex relationships among words and phrases. Problems here are truly baffling to computers. As machines, they lack the innate ability to understand indirect phrasing, misused words, poor sentence structure, dangling modifiers and sarcasm. These of course are all hallmarks of human speech but typically give the computer fits. This area is still in its early days and is evolving. Discussions can go deep and sound a lot like philosophy and indeed reach into philosophical realms. Those of you expecting a bracing explanation of ontologies are likely to be disappointed.
Patterns and relationships
In any text analysis exercise, we begin with a document, which is simply any collection of words. A document can be as short as a phrase and as long as or even longer than an encyclopedia. We also can analyze many hundreds or thousands of documents looking for patterns and relationships.
The computer must do extensive processing to this body of text to get its meanings. First, stop words (the, of, and, a, to and so on) must be removed. The frequency of these words is so large that they can swamp the analysis. They hold sentences together but the other words in fact convey the meanings.
Next, words must be made regular. There are many steps in doing this. First, spelling errors need to be corrected using a dictionary. Plurals must be singularized. Then we must do what is sometimes called stemming. Tenses need to be made uniform so that the same word does not get diluted over minor variations.
Some programs go further to lemmatization. This is trying to identify the part of speech, so we know whether, say, “wax” is being used as a noun or a verb.
Other programs also attempt to resolve idioms. Some look for word pairs that have meanings, such as “not good” or “not bad.” Groups of words that have meanings may be flagged, such as “Iron Mountain Brews” as the name of a place, not three separate items. This last activity is called finding named entities.
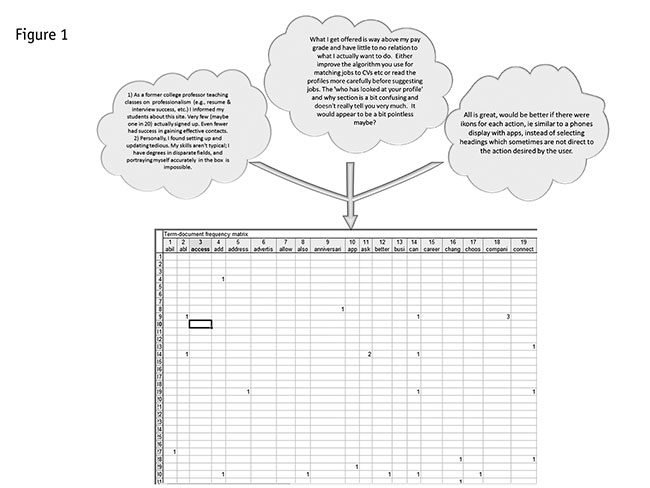
Sometimes this whole process is called tokenization. These tokens are what the computer processes. The computer can store these tokens in a variety of ways. One commonly-used method is called the word-vector model. This leads to something like a mostly blank spreadsheet. In this, each word that appeared in any document is a column and each document is a row. Each cell holds a count of how often each word appear in each document.

Figure 1 summarizes this process, where we have three documents (the cloud-like shapes) and the spreadsheet set up to hold their encoded contents. Recall that we have removed the stop words, so what is left are the words that bear meaning. Rules often get applied to limit the count of words (the columns). For instance, words that appear in the spreadsheet may be restricted to words that appear in more than 1 percent of the documents. Doing this, you may have somewhere between 300 and 600 words as columns.
Another method of corralling text is called the sequential model. This involves a search for words occurring near each other in the document. This differs from the word-vector model, in which syntax is irrelevant. (That is, the word-vector model simply counts whether words have occurred in a given document and how often, ignoring grammar and syntax.)
An often-used method is searching is called n-grams. This uses what is called a sliding window, which is like a box that is a set number of words (five, six, seven, etc., words in length) that moves through the document.
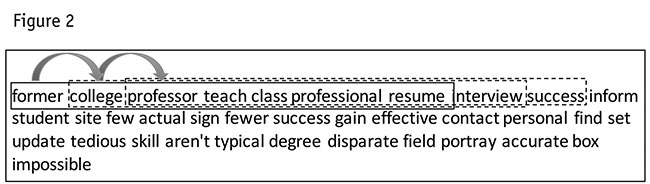
Figure 2 shows a sliding window of seven words’ length taking two steps through text which has been cleaned of stop words and regularized in tenses and word endings.
The sliding window at each step has been outlined with different borders and slightly offset so that its progress through the text can be seen more clearly. This process produces a table showing how often words occur together in the sliding window as it moves through the document. More technically, this table is called a similarities matrix.
Once we have done all this processing, we then can begin.
One more ingredient
For a predictive analysis, we need one more ingredient than processed words: a target or dependent variable. This typically is a data item that gets collected outside the words themselves. It could be something near the text, like an online rating that accompanies commentary. It also could be linked to the comment by matching files, for instance, as when purchasing data that gets linked to the text comment. It also could be an overall rating collected in a survey that can get linked to text commentary.
Analysis could be based on individual words or phrases but can gain considerable power after the data has been coded, just as we would do for any questionnaire. Coding allows phrases to be processed as single units. Some very smart programs can do much of the coding now. (We are not recommending software but, as an example, the SPSS Text Analytics program did remarkably well, producing a highly detailed coding scheme.) Indeed, this machine-aided categorization of comments also would fall under the heading of text analytics.
For this article, we will be showing how text can predict intent to continue a service, using the relatively new and highly powerful method called Bayesian networks or Bayes nets. (My book Practical Text Analytics has other predictive models using classification trees or CHAID and regression.)
Bayes nets both can focus in on the variables that are most important and create a model showing how those variables fit together. This method puts these variables into a network, where all the variables are connected and any change in one variable takes into account all the other variables.
If you are at least passingly familiar with structural equation models (SEM models) or PLS path models, these Bayes nets models will look similar – variables and connectors. However, Bayes nets can be truly data-driven – that is, entirely or largely be self-constructed, with the data creating the patterns of connections. You can find a more in depth discussion of Bayesian networks in another article.1
This example comes from a large online community of professionals, such as engineers, who use a software and computer services company. Their verbatim comments have been gathered into 79 codes (each code gathering similar comments) and these will serve as the predictors or independent variables. These engineers were also asked if they intended to renew with this provider. Whether or not they intend to renew (“will renew”) is the dependent or target variable.
The first step is isolating variables that have the most influence. This set is called the Markov blanket. These are all the variables that fall closest to the target variable. (In a network, variables that are closest together have the most influence on each other.) Exactly how Markov and his blanket come into this is a long discussion that we will save for another time. What we need to know now is that the Markov blanket comes from a search for strong connections—sifting through the variables many times.
We have gone down to 18 variables. Figure 3 shows the best Bayes net. Using these we grew the network again, allowing it to find the optimal configuration. This network explained or predicted patterns in the target variable best after a stringent type of testing called cross-validation.
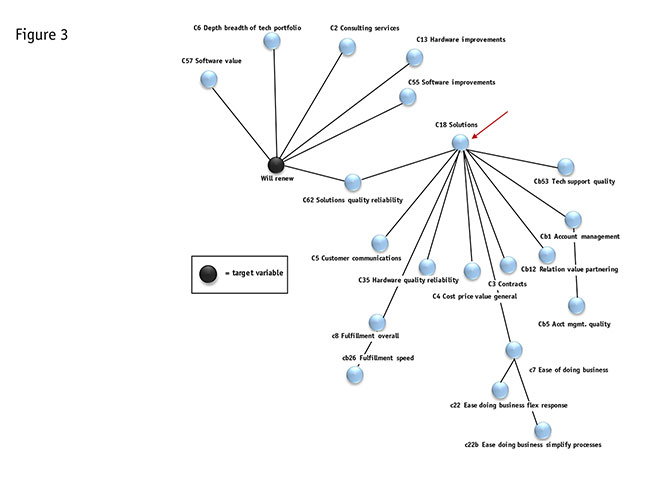
This data-driven, automatic layout looks very sensible. For instance, the variable solutions (pointed out with the red arrow) leads to several specific variables, such as “customer communications,” “fulfillment overall,” “hardware quality and reliability,” “cost price value, general,” and so on – all of which seem like very logical parts of this broader variable. “Solutions” also has a direct connection to “solutions quality and reliability,” which in turn connects to the target.
Other variables linked directly to the target include software value, depth/breadth of technology, consulting services, hardware improvements and software improvements. Again, variables that link directly generally have the strongest influence on each other.
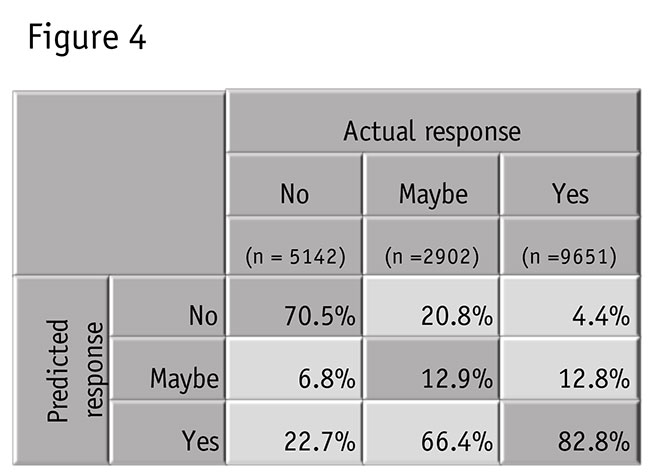
The network performed remarkably well in predicting intent to renew. Figure 4 shows how this fell out, in a correct classification table. We see from this which people the model would predict as renewing or not, based solely on their comments.
Overall, the model correctly predicted intent to renew with 68.1 percent accuracy. The two extremes, and “yes” in particular, are predicted with very well (“yes” is 82.8 percent correct). Only those saying “maybe” to renewal did not get captured well. The majority of them look like those who say they will renew (66.4 percent misidentified as saying “yes” based on their comments).
However, maybe the model is picking up something about those sitting on the fence and perhaps most them ultimately would say “yes.” Their commentary at least suggests that this is so.
The Bayes net also calculates how much influence each variable has. Figure 5 displays the effects.
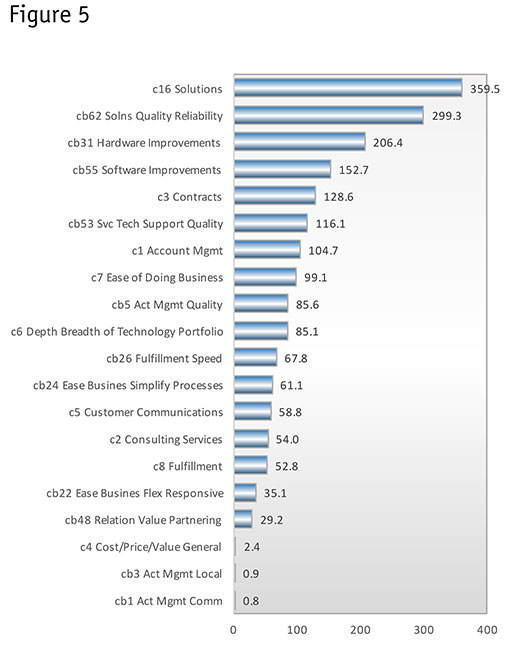
The chart has been indexed, so that the average of all the comments is set to 100. Note that “solutions,” which was the linchpin of many other important variables, emerged as having the strongest effect on the dependent. This means that if the client can make changes in “solutions,” this will have the most effect on changing intent to renew. However, we can see from the diagram that “solutions” is a variable with many parts. For solutions to change, its closely-connected variables will have to change as well.
“Solutions reliability and quality” is the single most specific area with the strongest effect. Following this are hardware and software improvements. Another more detailed chart (which is not shown) reveals that these have a negative direction – the more mentions, the less likely a person is to say she/he will renew.
We can see here that text commentary, encoded and in connection with an overall rating, can lead to a strong predictive model. We can learn about which variables are important, get an accurate prediction and understand the strengths and relationships of the predictor variables. Those are all the needed ingredients of an excellent model.
Explain patterns
Predictive approaches seek to find the words or combinations of words that forecast or explain patterns in a dependent variable, like share of spending or overall rating. To get these powerful methods to work, you must have information other than the text itself. That is, you must know something else about those who made the comments, whether it is a rating, an intention or a behavior. Predictive text analytics can serve as a guide to action and can have surprisingly strong power. It has worked especially well with text that has been encoded to find underlying ideas or themes.
For all the usefulness of the predictive approaches, they are relatively less used than more descriptive methods. These latter methods show broad patterns and relationships among words. They also are highly pictorial, which may explain some of their appeal. We will discuss these methods, and more about how they contrast with the predictive methods, in next month’s article.
REFERENCES
1 The Bayes nets article appeared in two parts in Quirk’s.
www.quirks.com/articles/2013/20130306.aspx
www.quirks.com/articles/2013/20130406.aspx