Editor's note: Steve Cohen is partner and co-founder of in4mation insights. He can be reached at scohen@in4ins.com.
When developing new products or services, brands often obsess about the attributes they hope will influence consumer behavior, often using choice models to identify characteristics that are most persuasive.
Big surprise? Only some of the attributes you bake into your products command enough consumer attention in the moment of purchase to influence choice in meaningful ways.
Discrete choice models work best to identify the attributes most likely to influence consumer choice when they accommodate attribute attention as a component of choice criteria. In this article, we share what we believe is the best way to address attribute attention, using an improved approach to choice modeling.
May not process all attributes
Classic choice models assume that people maximize their utility by processing all attributes when making their choices. For various reasons, people may not process all attributes but rather select important ones and/or ignore unimportant ones.
Choice-based conjoint analysis (CBCA) has been a bedrock of marketing research for many years. A basic assumption is that by displaying a full set of product attributes to the consumer, she will use all information in her decision-making. A challenge is the interpretation of a small importance coefficient for an attribute. Is it small because the attribute was processed but she doesn’t care about it? Or was the attribute ignored and not processed at all? Choice models assume that people use a trade-off decision process that takes into account all the information available.
But is that true? Are all attributes used? Does everyone use the same ones? Are predictions from CBCA the same when we assume everyone pays attention to all attributes versus every person only pays attention to attributes of salience to them personally?
If you could estimate who does and does not utilize all attribute information, and learn which attributes those are, you would get better results than under the standard “all attributes” assumption. Attribute attendance choice models provide better results, closer fit to choice data and yield a deeper understanding of exactly what drives choice behavior.
To investigate this we used a CBCA approach that we call attribute attendance choice-based conjoint analysis or AA-CBCA. The data was based on a study concerning consumers’ choice of an infrequently purchased durable product with seven attributes: (1) brand; (2-5) four ratings of aspects of the products’ performance (taken from a reliable product review source); (6) the number of years included in the warranty; and (7) price.
Attribute attendance is estimated by assuming that some people did or did not pay attention to each attribute. Whether someone is paying attention to each attribute is unknown beforehand but our AA-CBCA approach hypothesizes that each individual pays attention to each of the seven attributes disproportionately. This “paying attention” is measured by seven latent (meaning hidden or unknown) binary measures – one for each attribute.
At the same time, we extracted choice-based latent classes, which tell us the if the importance of each attribute that is processed differs across different groups of people. This is a choice-based segmentation of the respondents which uncovers people whose drivers of choice are different from one another. In this case, we also take into account whether they pay attention to each or not by using the seven latent measures.
Each respondent completed 10 choice tasks with five different alternatives shown: four branded products described by the six remaining attributes plus the choice of NONE. We randomly selected one task as a holdout and estimated AA-CBCA using the remaining nine choices. For now, we omit the interpretation of the choice-based segments.
We compared results from AA-CBCA using just the nine choice tasks against the results of a latent class choice model (LCCM) that does not account for attribute attendance. Again, only AA-CBCA includes the seven latent binary attribute attendance groups.
Bayesian information criterion (which we refer to as BIC) is a number that evaluates how well the predictions from a model fit the data it was generated from. In statistics, BIC is used to compare the results from different possible models and to determine which one is the best fit for the data. Lower numbers are better.
The best-fitting model according to BIC is the one that explains the greatest amount of variation using the fewest possible independent variables. “Best” in this case means the model with the smallest BIC compared to models that were estimated with fewer or more latent choice classes.
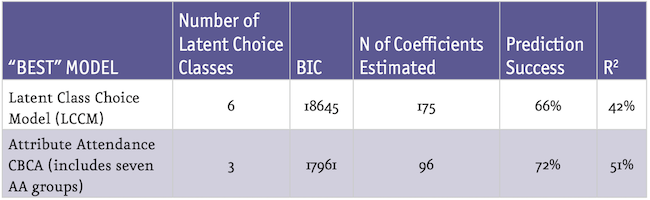
The table shows the results of the best-fitting latent class choice model and attribute attendance-CBCA analyses. For example, in the LCCM row, a six-group solution yielded the lowest BIC when compared to LCCM solutions with two, three, four, five and seven latent classes (these results are not shown for article brevity).
In the attribute attendance-CBCA row, the model with seven binary attribute attendance groups and three choice segments provided the best fit when compared to fewer or more latent classes, each with seven binary AA groups (again, not shown).
You will note that the BIC for attribute attendance-CBCA is smaller than the best latent class choice model results. This means that attribute attendance-CBCA provides a better overall fit to the choice data than does a standard latent class model.
Prediction success (PS) measures the ability of the model to predict the nine actual choices made by the respondents. PS favors attribute attendance-CBCA over latent class choice models, and it only needs roughly half as many coefficients.
Finally, the R2 in any choice model measures the increased explanatory power over a simpler, more naïve model. The R2 tells us that seven binary attribute attendance groups and just three choice classes explain more of the data than does a six-group standard LCCM.
Delve deeper
What else can we learn from Attribute Attendance-CBCA? Since people were classified into paying attention or not to each of the seven attributes, we can delve deeper.
The product under study is infrequently purchased, so we think that explains why the brand name is used by just one-third of people. People are just not aware of each brand’s value since they are not in the market for their products often.

Instead, the online review site, well-known across product categories, is used just about all the time (Rating 1 and 3) or almost always (Rating 2 and 4). Trailing behind these are the price and the number of years of warranty (see table).
We can also ask: How many people pay attention to or use all seven product attributes in their decision-making? Sadly, just 10% of people employ all seven attributes, another 17% pay attention to six (all attributes except brand) and 11% pay attention to five (all except brand and warranty). These findings suggest strongly that the product ratings should be featured prominently in any communications with consumers.
Capture attention and influence choice
Especially for infrequent purchases or in categories where people may be unfamiliar with the features and functionalities of the category offerings, it is important for marketers to design products or services with attributes that are beneficial and differentiating. Just as important is knowing which attributes are most likely to capture the consumer’s attention and influence choice in the critical moment in which they are considering your product versus that of a competitor. We believe therefore that attribute attendance-CBCA is a strong addition to understanding buyer behavior when developing or marketing a new product and should be included in your next investigation of consumer choice.