
Winning over Gen Z
Editor’s note: Schumaila Kumar is a vice president at Phase 5. This is an edited version of an article that originally appeared under the title “Gen Z – The Power of Enhanced Surveys.”
The digital landscape is continuously evolving, with Gen Z at the forefront. For brands and marketers researching Gen Z, keeping them engaged has become a challenge, especially in online surveys where attention spans are known to be short. However, our recent experiment (in partnership with Dynata) offers valuable insights for those looking to enhance their survey approach.
Engaging Gen Z – The experiment conducted
In July 2023, we conducted an online survey of 952 Gen Z consumers (aged 18-29 years) in the U.S. and Canada. Respondents were sourced from Dynata’s online research panel.
We wanted to determine if survey experience could impact engagement and data quality. Our hypotheses were:
- “traditional” surveys with text-heavy questions are less appealing to this audience;
- surveys that use more conversational language, more visuals and interactive features would be more engaging for younger audiences and would increase engagement and response quality.
We used a split sample approach, in which half of the respondents were shown the standard survey version and the other half the enhanced survey version.
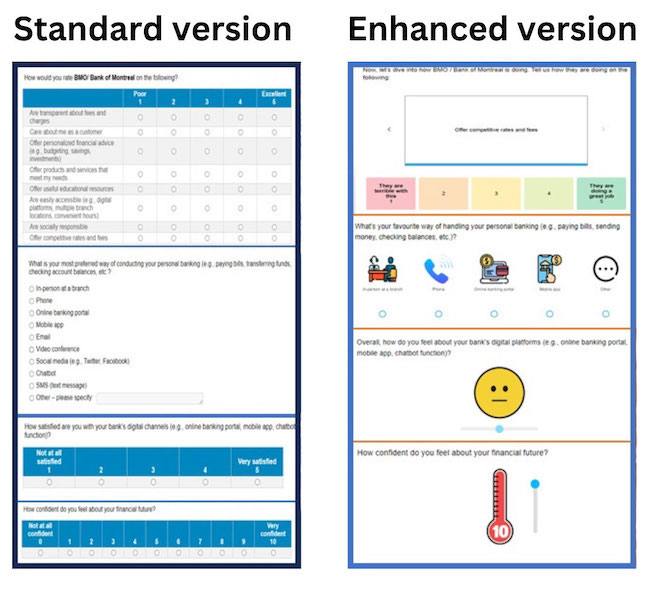
Survey question examples: Standard version vs. enhanced version
What were the key findings?
Engagement increases when using a visually appealing format
Our findings suggest that visual design matters to Gen Z. Nine-in-10 respondents felt the enhanced survey version provided an engaging experience compared to eight-in-10 for the standard version. This is largely driven by visual elements:
- Eighty-one percent agreed that the enhanced survey offered compelling visuals (e.g., scales, images), whereas only 48% felt that way for the standard version.
- Standard survey respondents were also significantly more likely to cite “better visuals” as an improvement suggestion for the survey.
Longer engagement
The enhanced version had a longer average completion time (9.8 minutes) compared to the standard version (6.7 minutes). Yet only few (3%) expressed frustration with the survey length. Forty-seven percent thought the survey was the perfect length, whereas 49% described the survey as short and engaging.
Richer feedback
The longer completion time resulted in richer feedback. The enhanced survey version elicited detailed, open-ended responses, offering deeper insights into respondent perspectives. For instance, when discussing their experience with their main bank, respondents in the enhanced survey group shared more nuanced feedback, highlighting specific features, personal experiences and loyalty stories.
Below are a few verbatim examples:
- “They have a great mobile app that lets me see my money 24/7, has discounts for things I shop for, easy to transfer money via friends/family. As for the bank itself, easy to know what fees they have. They offer a program that waives the fees due to the fact that I am a university student. Overall, treats me nicely.”
- “I've been with them for many years and have never had any issues, so I think I stay with them as a comfort thing mainly. The staff at most locations are generally friendly, fast and have never given me any headaches.”
- “They have amazing customer service. I have been with them since I was 10 years old. My parents first brought me to open a kids account. They have been very useful in helping me navigate financials while on disability.”
On the other hand, respondents from the standard survey group were more likely to provide short and concise responses, such as: “good”, “convenience and reliability” or “happy with service.”
Future engagement
Another promising take away: Respondents from the enhanced survey group are more likely to engage in future surveys – 71% expressed a high likelihood to participate again in a similar survey as compared to 65% from the standard version group.
What does this mean for brands?
1. Visuals drive survey engagement
Incorporating colors, emojis, icons and other visuals isn't just for aesthetics, they positively affect survey engagement. Additionally, interactive features, such as drag-and-drop functionalities, sliders or thermometer scales, can further enhance survey participant involvement.
2. Gaining insights and detailed feedback
An engaging survey experience can yield richer feedback, which, in turn, provides more actionable insights for brands.
3. Future engagement
A positive, engaging survey experience can increase the likelihood of participants returning for future surveys.
Creating an online experience for Gen Z
Engaging Gen Z in research requires more than just asking survey questions. It's about creating an online experience – a balance between visual appeal, interactivity and meaningful content. As we move forward, the nature of online surveys will continue to evolve, with traditional surveys being more and more replaced with “enhanced versions” to better engage with and to gain deeper insights from younger generations.