Editor’s note: Juliet Bakhmut is senior content strategist at research firm CoolTool, San Francisco. This is an edited version of a post that originally appeared under the title, “The ultimate guide on how to analyze eye tracking data.”
 Running eye-tracking tests has become like a walk in the park. That is not a joke. Wireless eye-trackers and accessible software make it very easy for any researcher or marketer to get in-depth insights into consumers’ behavior on a website (including mobile sites), during the watching commercials (that is crucial for understanding advertising effectiveness) and at the moment of observing shelves with products (to get to know what package was the most attractive).
That said, the accuracy of eye-tracking insights still can be questionable, since many researchers don’t take into the account a number of peculiarities of the eye-tracking process which compromises the quality of final data.
In order to address this issue, we referred to the knowledge of neuroscientist Tim Holmes. Check out the tips below on how to conduct proper eye-tracking tests and to achieve ultimate data accuracy.
1. Always pilot before going full-scale
Even the most meticulously planned neuromarketing research, regardless of how perfect it looks on paper, can fail in real life conditions.
Before launching full-scale research, gather several participants and walk through the test logic with them. Test both the logic framework of the test and applied equipment.
Do it slowly, step-by-step, and consider participants’ feedback. It’s better to polish small inconsistencies and mismatches at the early stage of the research than to deal with consequences of large volumes of inaccurate data collection.
2. Eye-tracking calibration: Too important to ignore
It’s worth calibrating your eye-tracking equipment correctly in order to ensure the proper mapping of gaze.
When testing a particular object on screen it’s always worth remembering that regardless of how strong we encourage participants to look in “the right direction” their gaze will stroll far beyond the object of testing. That’s why it’s important to take into the account the screen resolution and size, especially when you compare your object of testing with those of competitors (for example, during a shelf test).
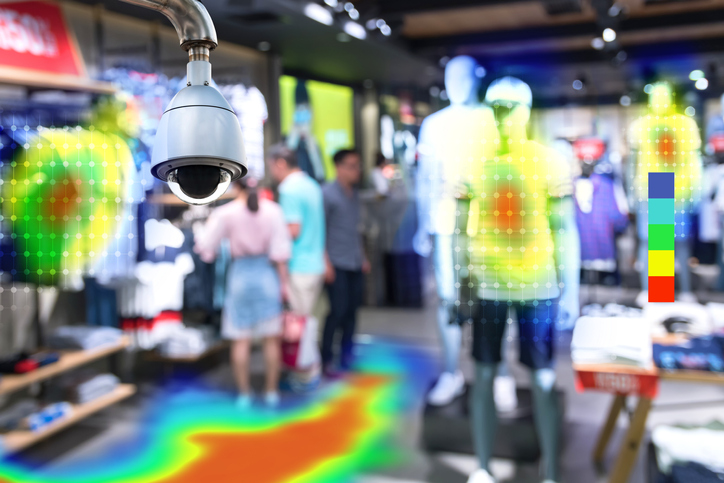
3. Don’t be limited by heat maps
Heat maps look great and are an easy-to-use tool to analyze gaze patterns. Heat maps are so popular because of the easy visualizations which clearly show where users looked and which areas of interest attracted their attention the most. We really like to observe heat maps in video format!
While it’s a really handy tool, information may be insufficient or even misleading. It’s always better to support heat maps with analysis of such parameters as fixation duration, gaze plots and other eye-tracking metrics.
Comprehensive analysis of metrics helps to identify research outliers that can’t be clearly registered by heat-maps but influence the quality and content of obtained data.
4. Omit central fixation bias
Central fixation bias is a tendency of research participants to look at the center of the image.
This bias is quite widespread and in the majority of cases manifests itself during the first moments after the appearance of the tested object on the screen. It means that during the analysis of heat of opacity maps you will see that the central area of the image attracted the most attention within the first seconds after the demonstration of the stimuli.
This information can be misleading, especially if the tested object is inside of this area. It’s recommended to analyze fixations of gaze that occur one-to-two seconds after the initial demonstration of the tested image. Also, in order to mitigate the influence of this bias, it’s better to place the tested object outside of the center of the screen.
5. Clearly define areas of interest
Area of interest (AOI) is a spot on the tested image which you can point out in order to get detailed information on users’ interactions with it.
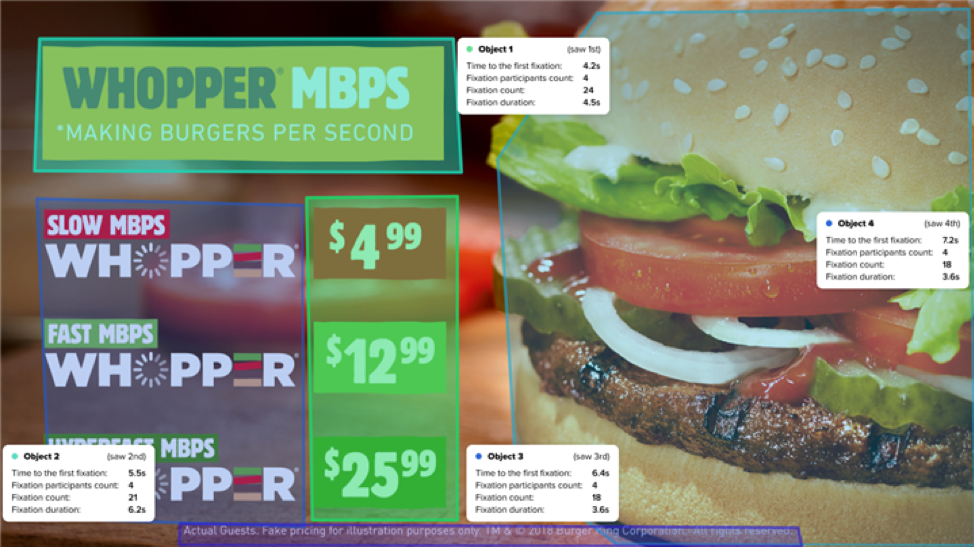
Very often researchers, especially commercial ones, want to get as much information as possible from the test because they are obsessed with value-for-money indicators. As a result, they cover the entire web page or tested object with AOIs ,which isn’t a good idea because every eye tracker, even the most precise one, has a margin of error.
As a rule, margin of error falls in the range between 0,5-1 degree for high-quality eye trackers, which means that the accuracy of gaze catching will be compromised by 0,5-1 cm from approximately 60 cm viewing distance.
We hope these practical tips will help you improve the quality of eye-tracking data you collect. If you’d like to see case study examples, visit https://eyetrackingcases.gr8.com/ (free, registration required).