Editor's note: Conor Wilcock is research director in the New York office of research firm B2B International.
As market researchers, our primary goal is to ensure that the insights we provide to our clients or to internal teams are as actionable as possible, while maintaining high levels of validity. However, delivering this in global research projects is a challenge due to the variety of cultural biases at play. So how can researchers empower organizations using actionable insights, when conducting research across borders?
Charles Kettering, once head of research for GM, said that “a problem well-stated is a problem half-solved.” Simply being aware of and understanding the cultural biases which exist in market research is as important as identifying ways of accounting and reducing them. Research conducted by our firm, B2B International, on cultural bias in numerical rating scales has found that a respondent’s culture primarily affects the relative strength of three response styles:
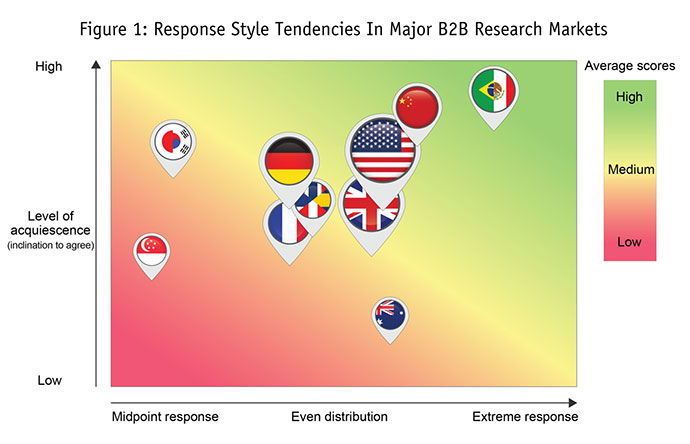
- Extreme response style (ERS). This is the tendency to use the extreme ends of a scale (e.g., 1-4 and 9-10 on a 1-10 scale). Our research found that respondents in Latin America lean strongly to the extreme response style; Chinese respondents also exhibit extreme responses, although to a lesser extent. A strong ERS usually leads to higher aggregate scores.
- Midpoint response style (MRS). This is the tendency to use the middle ratings on a scale. For a 1-10 scale, this generally means 5-8. The strongest midpoint response style was produced by respondents from Southeast Asia, namely Japan, Korea and Singapore. Some Western European markets also exhibit a similar response style, such as France and Germany. A strong MRS usually leads to lower aggregate scores.
- Acquiescence bias. Similar to social desirability bias, this is the tendency to respond in a way which is per-ceived to be desirable to the interviewer or survey sponsor. Countries or regions which exhibit a strong ac-quiescence bias include Latin America, China and Southeast Asia. Respondents in Australia, Singapore and France showed little to no such bias. A strong acquiescence bias generally leads to higher aggregate scores. The chart in Figure 1 summarizes high-level cultural bias in business-to-business research, in terms of typical response styles.

This analysis validates previous literature on the subject, although such studies focused exclusively on con-sumer markets, while the focus of our analysis was on B2B audiences. However, researchers should avoid making broad conclusions about cultural bias without first taking into account other factors which may affect response styles within and among cultures. We also must appreciate that the research world is constantly changing, as are the ways in which respondents approach surveys and rating scales. Understanding these trends is critical in any attempt to account for and address cultural bias in global studies.
A comparison of cultural bias studies conducted in consumer circles with our analysis of B2B research shows similar results. This makes sense, considering that every business decision maker is a consumer when they leave for work in the morning and return home in the evening. Cultural biases should – and do – circumvent the work/home threshold. However, there are key differences when examining response styles of B2B versus consumer respondents within countries.
Generally speaking, B2B respondents are less likely to provide extremely positive or negative ratings on a survey scale. This could be due to the longer-term relationships which exist in B2B markets; such tenured interactions could lead to a “smoothening” out of scaled responses, because of the expected ups and downs of such a relationship.
Our theory is supported by looking at the range of Net Promoter Scores for consumer brands versus B2B brands. Generally, the worst-performing consumer brands receive lower Net Promoter Scores than their B2B equivalents (imagine the energy company or Internet service provider that makes your blood boil). The story is the same with the best-performing brands. When conducting B2B2C studies which include consumer and business respondents within one country, researchers may anticipate more “bunched” responses among the B2B sample.
Interesting shifts
Our analysis uncovered some interesting shifts over time. B2B survey response styles across many parts of the world are changing and our firm’s research and analysis shows this happening most notably in developing markets, potentially as a result of businesses in these regions having more interaction with Western firms. Nowhere was this shift more notable than in China. Response styles among Chinese B2B respondents have become less extreme over the last three to five years and now more closely mirror the likes of the U.S. and U.K. We might expect to see a similar shift for Mexico and Brazil as they do more business with Western countries and as B2B research becomes more entrenched and less of a novelty.
Generally speaking, the more senior a respondent is, the more they will tend to exhibit a slightly stronger midpoint response style and a significantly weaker acquiescence bias. This typically leads to lower aggregate scores when compared with those in junior roles in the same country.
This distinction is more apparent in countries that typically have stricter and more linear business hierarchies. In China, for example, businesses often operate a Confucian hierarchy, where senior executives are “benevolent leaders.” The drop in acquiescence bias when surveying a senior respondent is therefore greater in China than in Scandinavia or Australia, where hierarchies are more casual or even non-existent. Interestingly, it’s in these countries where we see a lower inclination to agree with, or please, the interviewer or survey sponsor in general.
Researchers can reduce confusion and to a certain extent cultural bias by anchoring numerical scales, to ensure clear and objective definitions are communicated to respondents of all nationalities. In a satisfaction survey, this generally means “1 – not at all satisfied” and “10 – completely (or extremely) satisfied.” Without anchoring, researchers put themselves at the whim of respondent subjectivity: a score of 7 out of 10 will be interpreted very differently in Japan versus in Brazil.
Anchoring also avoids respondent confusion as to which end of the scale is positive and which is negative. In German schools for example, outstanding students are given a score of 1. Therefore, many Germans enter adulthood with the subconscious perception that 1 equals the best score possible. We certainly would not recommend flipping a rating scale for German respondents only in a multi-country survey; rather, clear anchoring should serve to eliminate inaccurate grading.
Generally, native-language interviews result in more extreme responses, while non-native language interviewing (e.g., using English in Scandinavia) result in more midpoint responses. For example, a survey conducted with Norwegian respondents in English will likely lead to lower aggregate scores than if the surveys were administered in Norwegian. This may be because they feel more confident responding in their native tongue and therefore more likely to answer assertively.
Rather than adopting English as the default language for global surveys, researchers should seek to administer them in native languages. While this won’t eliminate cultural bias, it will lessen the negative skew in the data caused by strong midpoint responses.
There may be temptation for researchers to attempt to eliminate cultural bias from research datasets by ap-plying weighted algorithms, the intention being to standardize the results. For example, researchers could utilize an algorithm based on typical response styles which may shift a company’s Net Promoter Score (NPS) up or down according to each different country in which it operates.
Arbitrary formulations of this nature can be damaging to research and subsequent action plans, as they are determinist and reductionist. Increasing Japan’s NPS by 35 points and reducing Mexico’s by 20 – to use a basic example – throws aside the possibility that other factors (biases as well as the company’s actual performance) may be at play. It’s incredibly difficult to quantify the effect of one bias and impossible to quantify the cumulative effects of all biases in a survey. Therefore, ensuring sampling consistency is the only way to account for and to control cultural bias over time.
Benchmark and track metrics
When conducting tracking research, it’s important for researchers to distinguish between “real” change (in market needs, perceptions, brand performance) rather than change due to sampling differences – for example, a higher proportion of Korean respondents from wave to wave. By ensuring sampling consistency – at the front end by setting quotas or at the back end by establishing weighting criteria to a dataset and applying the same weighting criteria to future survey waves – researchers can benchmark and track global metrics for which the cultural biases at play are consistent.
What’s critical for researchers to understand is that cultural bias is almost impossible to eliminate. Instead, the focus should be on understanding and accounting for it. We don’t need to remove the elephant in the room; we just need to know that it’s there.
With companies increasingly using cross-border research to inform global decision-making, it’s never been more important for researchers not only to understand and account for all the biases at play but to put the right methods in place to control the impact they have on research findings.