Changing their beliefs
Editor's note: David Soorholtz is managing director at Kleffmann North America Inc., a Des Moines, Iowa, research firm. Terry Grapentine is an independent marketing research consultant based in Ankeny, Iowa.
We have conducted B2B marketing research since the late 1970s and observed an increasing tendency of customers in some B2B markets to display what we describe as inertia in their buying habits. Clients describe some of their customers and prospects as rarely switching brands and, seemingly, not because of brand loyalty. Rather, clients describe these customers as being on autopilot: They don’t seriously consider brand alternatives in the face of new product introductions and many express the belief that, “If it ain’t broke, don’t fix it.” Psychologists refer to this behavior as cognitive inertia:1
“Cognitive inertia refers to the tendency for beliefs or sets of beliefs to endure once formed. In particular, cognitive inertia describes the human inclination to rely on familiar assumptions and exhibit a reluctance and/or inability to revise those assumptions, even when the evidence supporting them no longer exists or when other evidence would question their accuracy. The term is employed in the managerial and organizational sciences to describe the commonly observed phenomenon whereby managers [or customers] fail to update and revise their understanding of a situation when that situation changes, a phenomenon that acts as a psychological barrier to organizational change [or brand switching].”2
This is an active topic in the academic literature and many articles have been written about inertia in B2B marketing. For example, Yanamandram et al. (2006) examine inertial tendencies as a major component of “switching barriers” in selected B2B markets;3 White et al. (2007) investigate inertial and customer retention issues in B2B service markets;4 and Fred Wiersema (2013) discusses inertia from the perspective of global B2B markets.5 Some of the findings coming out of this and our own research suggest that inertia can be a significant problem in B2B markets where, for a given product category, many good alternatives are available from different competitors and where assessing product performance prior to product purchase is difficult.
B2B marketers want to believe that their customers behave rationally and make brand decisions in a logical and fully-engaged manner. We have found, however, that all too often this is not the case. Do these customers just not care? Or do they simply not understand that manufacturers are often providing important inputs that they can use in their businesses?
We believe that in many cases, it is not that customers do not care or fail to understand these products or issues; rather, they are experiencing cognitive inertia.

Set of beliefs
Cognitive inertia is a set of beliefs – not related to conscious brand loyalty – that result in business customers failing to switch brands over an extended period of time. Example perceptions that can lead to cognitive inertia are that:
- Switching brands entails too many risks that cannot be adequately assessed prior to switching (e.g., changing brands may lead to undesirable effects).
- “All brands are the same,” so nothing is to be gained by switching.
- “I have better things to do with my time than investigate a new product.”
Recently, a B2B client wanted us to explore the issue of inertia in the hope that the research might shed light on how their marketing and sales departments might address this issue. One question they had was: Are some customers less inertia-prone than others and, if so, how can we best identify and market to them?
Note that this research focused on a single product category in which we and the sponsor hypothesized that cognitive inertia exists, based on our background market knowledge.
The research investigated whether the company could segment customers on their level of cognitive inertia and, if so, whether the firm could develop marketing strategies designed to budge the least inertia-prone prospects into considering the company’s products. The study (details of which are disguised to protect client confidentiality) was conducted in four phases: exploratory research, quantitative market segmentation research, target marketing assessment and product positioning development.
Step 1: Exploratory research
Two waves of exploratory research were conducted prior to launching the quantitative market segmentation phase of the study. The first exploratory wave involved conducting in-person interviews with customers in the target market. This research uncovered a significant amount of cognitive inertia among most respondents. The second wave involved conducting in-depth telephone interviews of customers who had recently switched brands.
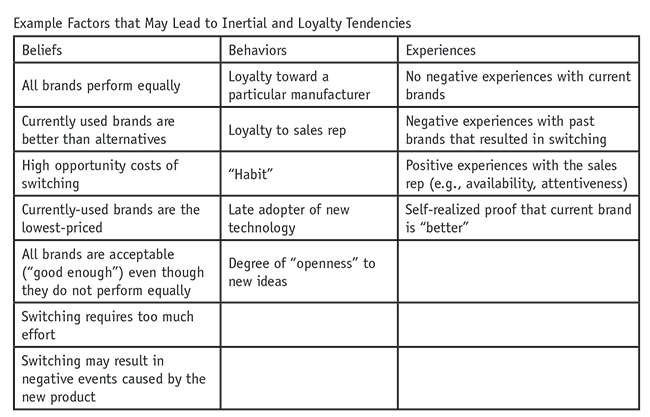
Both qualitative waves allowed us to compare and contrast customers who displayed varying degrees of cognitive inertia and brand switching behavior. The chart summarizes factors contributing to inertial and company/product loyalty propensities. Information from the chart informed the design of the quantitative market segmentation phase of the study.
One general observation coming out of this exploratory research is the concept of active vs. passive inertia. In some situations, inertia is active – for example, the customer consciously does not consider switching brands, not because he is loyal to the current brand but because he has been “burned” in the past when he switched brands and the current brand’s performance is acceptable. In contrast, passive inertia describes a situation in which the very thought of considering alternative brands is not salient – for example, the customer is too busy with other demands or she does not consider the product category in question important enough “in the scheme of things” to warrant researching alternative brands.
Example Factors that May Lead to Inertial and Loyalty Tendencies
Step 2: Quantitative market segmentation research
In this market, Internet panels of customers are available from several sources; consequently, we used a Web-based study lasting an average of 20 minutes.
The study identified six segments: Loyal, Distracted, Price, Status Quo, Unhappy, and Inquisitive. Figure 1 plots the segments along two dimensions – overall loyalty and inertial tendency. The size of the bubbles reflects the relative sizes of the segments.
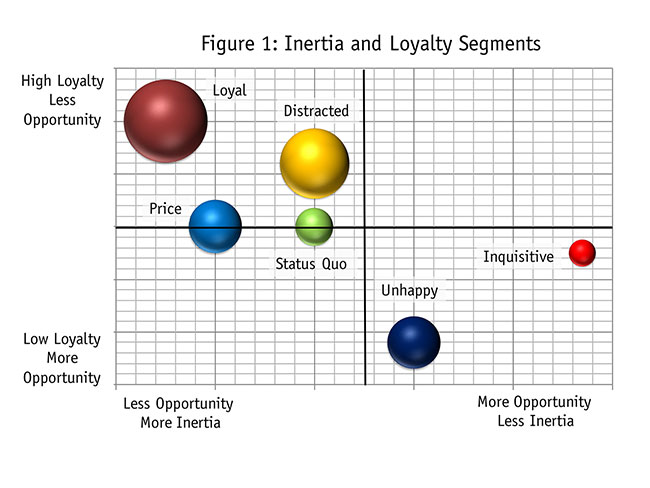
Overall loyalty, denoted by the vertical dimension, is an index made up of several attributes on which respondents rated a company with respect to the their satisfaction, likelihood to use in the future and likelihood to replace with another manufacturer in the future.
The horizontal opportunity/inertia axis is a composite score of several attributes measuring the belief that investigating alternative products is worth the respondent’s time and would actually result in finding a better product. The further to the right a segment is positioned on this axis, the less inertia-prone that segment is and the more opportunity it offers a manufacturer. The dark horizontal and vertical lines in Figure 1 help the reader to visualize the relative positions of the segments to each other.
Note two general findings from Figure 1. First, the combined relative size of the least-inertial segments – Inquisitive and Unhappy – is a very small portion of the entire market. This corroborated our prior hypothesis that most customers in this market exhibit high levels of cognitive inertia and do not offer much opportunity for the client. Motivating the majority of customers in this segment to switch brands is difficult if not impossible. Second, there is a general negative correlation between overall loyalty and cognitive inertia. On average, lower levels of loyalty are associated with lower levels of cognitive inertia. Finally, as a check of face-validity, historical self-reported switching behavior was higher for the Inquisitive and Unhappy segments vs. the remaining segments.
Inquisitive: This is the least inertia-prone segment and has average loyalty scores. A major factor that differ-entiates this segment from others is intellectual inquisitiveness with respect to the product category. Members of this segment are more likely to read professional publications about technology in this product category and are more likely to believe that, if they were to research alternative brands in the target category, they would find a better product. They are also the youngest of all segments.
Unhappy: This is the second-least inertia-prone segment and also the least loyal. Dissatisfaction with their current product supplier distinguishes these customers from those in the other segments.
Status Quo: Customers in this segment are relatively pleased with the performance of their brand and the company they purchase it from. They do not display any inquisitiveness about new technology or a desire to improve upon their current marketing practices with respect to the target product. In a sense, these customers are on autopilot.
Distracted: Members in this segment express above-average loyalty to their current supplier of the target product. What differentiates them from other segments is that they are simply so busy with other aspects of running their business that no real attention is given to the target product. “If it ain’t broke, don’t fix it,” is their management mantra.
Price: The existence of a price-oriented segment in B2B markets is not uncommon. It was expected in this market, since some customers serve retail trade areas with lower-than-average yearly household incomes. Their retail customers simply cannot afford to purchase more expensive products in the target category. Consequently, this segment purchases the least-expensive products in the category and will only switch when a comparable product at a lower price is introduced – which, in this market, occurs rarely.
Loyal: Members of this segment display the least cognitive inertia and express the most loyalty to their supplier. These purchasers have an excellent relationship with their supplier and feel loyal to the perceived excellent performance of the brand they purchase from that manufacturer. Interestingly, this is the single largest segment.
Step 3: Target marketing assessment
Once the market segmentation phase of the research is completed, the next step is to identify the most attractive segments in the group. As suggested in Figure 1, among the six segments we identified, two – Inquisitive and Unhappy – offer the company the most potential because of their a) relative openness to consider different brands in the target category and b) somewhat lower levels of loyalty toward their current manufacturer.
Step 4: Product positioning development
How then should companies address the Inquisitive and Unhappy market segments? Clients who have segmented their markets on loyalty/inertia have taken several steps.
First, many of the issues that define the segments can be observed or learned by the sales rep (e.g., “Which customers actually read professional journals?”). Consequently, we developed an algorithm that the company’s sales reps can use to classify its customers across the six segments. This helps to streamline the selling process by allowing reps to identify the most likely targets and stop beating their heads against the wall to convert the most inertia-prone customers. This algorithm can also be used by the company as part of its overall CRM strategy to use data collection methods other than in-person sales calls to profile its customers and target communications to the least inertia-prone.
Second, some clients have developed a Web-based information service helping customers find relevant technology-related articles and research across a variety of industry information sources. Reps distribute information to Inquisitive members about new developments in the product category. This helps to better serve the Inquisitive customer and prospect. Offering this type of “better service” is believed to lead, over the long run, to more sales.
Third, sales reps conduct brainstorming sessions to share past experiences in identifying and selling to members in the Unhappy segment. Think of this as improving one’s professional selling skills in order to motivate customers in this segment to give greater consideration to one’s brand.
A major barrier
In summary, the marketing literature and our experience strongly suggest that cognitive inertia is a major barrier to increasing a manufacturer’s market penetration in some B2B markets. This article presents a case study that identifies factors influencing customer loyalty and inertia and segments customers on these two dimensions. Based on these findings, strategies are developed to more effectively position the company and its sales reps in marketing to members of the Inquisitive and Unhappy segments. Moreover, by identifying the least inertia-prone segments, organizations can more efficiently focus sales and marketing resources on customers who have the greatest likelihood of increasing the firm’s market penetration.
Make no mistake about it, overcoming cognitive inertia in the B2B marketplace is difficult; however, by identifying and better understanding the factors that cause the inertia, marketers can nudge customers closer to their brand.
REFERENCES
1 Huff J.O., Huff A.S., Thomas H. (1992). “Strategic renewal and the interaction of cumulative stress and inertia.” Strategic Management Journal 13: 55–75.
2 Wikipedia, https://en.wikipedia.org/wiki/Cognitive_inertia
3 Venkata Yanamandram, Lesley White, (2006). “Switching barriers in business-to-business services: a qualitative study.” International Journal of Service Industry Management, Vol. 17 Issue 2, pp.158-192.
4 Lesley White, Venkata Yanamandram, (2007). “A model of customer retention of dissatisfied business services customers.” Managing Service Quality: An International Journal, Vol. 17 Issue 3, pp.298-316.
5 Wiersema, Fred, (2013). “The B2B agenda: the current state of B2B marketing and a look ahead.” Industrial Marketing Management, Vol. 42, Issue 4, pp. 470-488.