
Clarifying the abstract
Editor's note: Terry Grapentine is an independent marketing research consultant. He can be reached at tgrapentine@gmail.com. The author gratefully acknowledges the insightful comments provided by David Soorholtz, president of VetSense, whose feedback was instrumental in shaping the final manuscript.
A scientific model is a simplified representation of some aspect of reality, designed to explain observed patterns and predict future outcomes. Consider Newton’s three laws of motion. Rocket scientists depend on these laws to navigate the intricate gravitational dynamics of space travel. Newton's equations provide remarkably accurate predictions across vast distances, from launching satellites into orbit to slingshotting probes around planets and steering them toward distant Pluto and beyond. While not perfectly correct – modern physics has surpassed them – they remain “wrong in the right ways,” useful within the bounds of most practical applications, such as marketing research.
At its core, a model is a purposeful abstraction – a tool designed to simplify complexity in order to understand, predict or influence outcomes. A helpful analogy is a map. Like a model, a map only highlights information relevant to a specific task or objective. An aeronautical weather map shows pressure systems to guide pilots, not restaurant locations. A GPS map offers optimal driving routes, not cloud formations. Each omits irrelevant detail to sharpen focus and improve decision-making.
This is the essence of abstraction: stripping away the unnecessary to isolate what matters most. In science and marketing research, models function the same way. They capture patterns in marketing phenomena and relationships while leaving out noise. If a model tried to account for every variable, it would be as complex and unmanageable as reality itself. The value of a model lies in its ability to be usefully incomplete.
Specifies the functional relationships
A model represents a defined aspect of reality, clarifying one or more dependent variables – outcomes we aim to understand. For a marketing researcher that could be things such as customer loyalty or new product adoption. It links them to a set of independent variables hypothesized to drive those outcomes. Crucially, the model specifies the functional relationships that connect these variables, forming the foundation for empirical testing and strategic interpretation.
Clients often assume the model is the research's output. We recommend reframing this mind-set. In most engagements, it is more efficient and intellectually honest to begin with a hypothetical model that guides the design of the initial qualitative phase. This preliminary framework, grounded in the client’s institutional knowledge and prior experience, serves as a diagnostic tool, not a conclusion.
As qualitative insights emerge, the model can be revised to better reflect the decision drivers and behavioral dynamics surfaced during that phase. It is then empirically tested and refined through the quantitative phase, yielding a final model that integrates managerial intuition with empirical rigor.
It is a misconception that beginning with a model biases the research. On the contrary, it sharpens the inquiry. Comparing respondent feedback to the model’s assumptions enhances our ability to detect blind spots, refine constructs and validate causal pathways, particularly when studying complex outcomes such as customer loyalty or brand preference.
Figure 1 presents a simplified customer loyalty model. This structure – an example of a structural equation model (SEM) – specifies direct and indirect causal relationships among key variables, offering a robust framework for explanation and prediction.
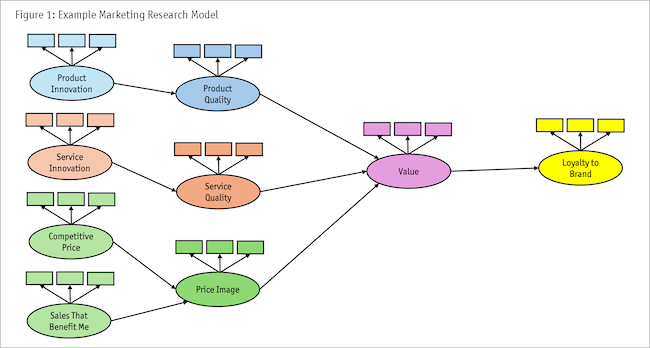
The ovals represent concepts that the researcher posits are relevant to the model. The boxes above the ovals denote questions (often image rating attributes) on a survey that measure the concepts. For example, three possible measures of product quality could be brand ratings on durability, component quality and product life.
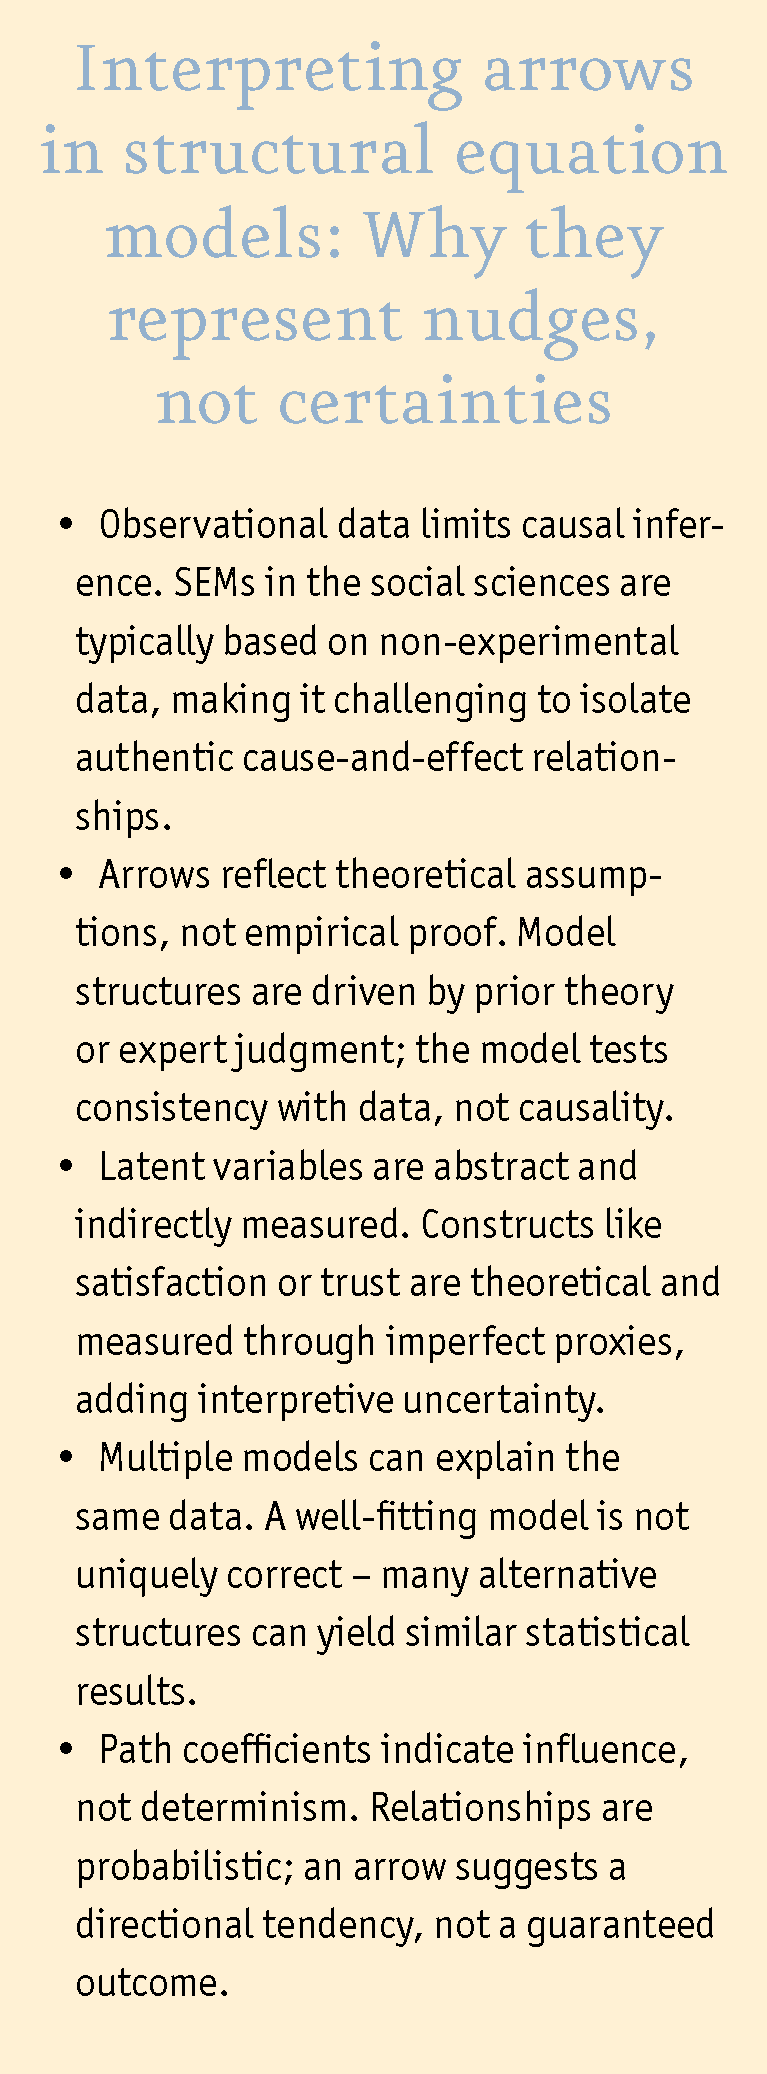
The arrows pointing from one concept to another denote cause-and-effect relationships between concepts. (See sidebar for a discussion on cause and effect in these models.) For example, consumers’ perceptions of a brand on value can influence loyalty to brand. Software used to estimate models of this kind places coefficients near the arrows denoting their relative influence on a dependent variable and a table summarizing each variable's impact on the model’s dependent variables.
Qual informs quant
Marketing researchers who create a model based on what they learn in the qualitative phase of a study and then test it in the study’s quantitative phase reap many benefits. Doing so:
Sharpens the research question: A model requires the researcher to articulate precisely what is being explained (e.g., brand preference, purchase intent, likelihood to switch) and what might explain that self-reported behavior.
Clarifies assumptions: Modeling forces explicit articulation of theoretical assumptions (e.g., “trust drives satisfaction” vs. “satisfaction drives trust”). This surfaces hidden premises and challenges unexamined beliefs before costly data collection begins.
Anticipates confounding variables and biases: A model helps you consider alternative explanations and potential confounds (e.g., demographic influences, prior brand exposure).
Improves questionnaire design: The model maps constructs to measures, identifying which variables require multi-item scales and which do not belong. This reduces survey clutter, increases validity and ensures every question serves a purpose.
Facilitates replication and learning: Well-specified models create a blueprint that can be tested across different segments, markets or time periods. This supports continuous learning and improvement of both the model and the strategy it informs.
Prepares for appropriate analysis: A model anticipates the statistical methods needed (e.g., regression, factor analysis, SEM), ensuring alignment between research questions, data and tools. This prevents post hoc rationalization or misuse of analytics to chase “significant differences.”
Strengthens inferences and decision-making: By testing a well-specified model, researchers can confidently say what is happening and why – a prerequisite for making strategic recommendations. Poorly specified studies often lead to action without understanding.
Facilitates stakeholder alignment: A pre-study model makes the underlying logic transparent to clients or internal stakeholders, ensuring alignment of expectations and reducing misinterpretation of results. This transparency aligns expectations and reduces misinterpretation of results.
Bottom line, modeling before measurement transforms research from data collection to disciplined inquiry. It embeds critical thinking into every phase, clarifying the question, guiding the method and improving the quality of insight.
Don’t tell the whole story
“All models are wrong, but some are useful.” This quote, attributed to British statistician George E. P. Box, reminds us of the limitations of all models: They are, as we have noted, abstractions of reality. They do not tell the whole story. Consequently, researchers and their clients must integrate their industry knowledge and background knowledge of fields beyond marketing to apply a model’s findings to business decision-making.
Background knowledge refers to the accumulated experience, operational context and domain expertise senior management brings to interpret marketing research models. When applied effectively, it ensures that analytic outputs are translated into actionable business insights.
Consider a B2B churn model developed by a research team. Key predictors include login frequency, support ticket volume, Net Promoter Score, product usage breadth and contract size. Surprisingly, the model identifies low support ticket volume as a strong predictor of churn – a result that initially defies intuition. After all, fewer support tickets should indicate fewer problems.
However, leadership quickly contextualizes the finding. High-value clients typically bypass the formal support channel and engage with dedicated account managers instead. In contrast, low-value or disengaged accounts underutilize the product, rarely log in and submit few tickets, not due to dissatisfaction but quiet attrition.
Key insight: Low support ticket volume is not a sign of customer satisfaction; it is a latent indicator of disengagement.
Had this operational nuance been identified earlier, the model could have been specified more precisely. This scenario highlights a recurring pitfall in exploratory research: When foundational qualitative work fails to uncover key business dynamics – whether due to sample bias, insufficient sample size, inadequate research scope, methodological shortcuts, or ignoring qualitative research best practices – model accuracy and interpretability suffer. Robust model-building begins with rigorous qualitative discovery and must be grounded in the enterprise’s strategic knowledge base.
In another example, a CPG company develops a model (via a conjoint study) to understand price sensitivity for a new line of premium Greek yogurt. The model finds that price elasticity is surprisingly low. Consumers appear relatively insensitive to higher prices compared to competing brands.
From a purely econometric standpoint, this suggests room to increase price without sacrificing demand. However, applying concepts from behavioral economics flags a different interpretation: The apparent price insensitivity may not be rational economic behavior but rather an instance of the price-quality heuristic – a well-documented cognitive bias in which consumers interpret higher prices as a signal of superior quality or health benefits.
Additionally, the research team identifies loss aversion in qualitative follow-ups: Consumers fear switching to a cheaper brand might lead to lower taste or ingredient quality. This asymmetric risk reinforces brand loyalty at higher price points. Instead of simply raising price, the brand team: 1) maintains price but reinforces quality cues in messaging (e.g., “triple strained,” “ethically sourced,” “gut health backed by science”) and 2) introduces a decoy product at an even higher price point to anchor perceptions (behavioral framing).
Make the model your strategic narrative
Use model creation as a narrative and analytical thread throughout the research process to engage stakeholders by giving them a sense of structure, purpose and evolving insight. Below are key suggestions for leveraging model development from the exploratory research phase to the final presentation.
Start with a hypothetical model as a cognitive anchor. Purpose: To set the stage. How: Introduce a provisional model early in the research process based on background knowledge, prior research or managerial intuition. Why it works: It gives stakeholders a mental framework, shows you're not starting from zero and prompts early engagement by allowing them to react to something concrete. Example: “Here’s a preliminary model of what we believe drives brand loyalty. What’s missing or misaligned from your experience?”
Use the exploratory phase to challenge and refine the model. Purpose: Demonstrate intellectual humility and analytical rigor. How: Present qualitative findings not just as themes but as evidence to revise the initial model. Highlight new variables, reshape assumed relationships. Why it works: It frames qualitative work as discovery rather than confirmation, which stakeholders find more credible and intellectually engaging. Phrase to use: “The model helped us ask better questions. What we heard surprised us – and reshaped our thinking.”
Guide quantitative design through the evolving model. Purpose: Build confidence in the logic of your study design. How: Show how survey questions, experimental treatments or segmentation logic are directly derived from the revised model. Why it works: It connects the dots between theory and measurement, reassuring stakeholders that the research is purposeful and coherent. PowerPoint slide idea: “From revised model → survey design → testable hypotheses.”
Use the final model as a sense-making tool. Purpose: Anchor the interpretation of results. How: Present final findings as a validated model (e.g., SEM, path analysis, key driver analysis), explicitly showing what matters, how and to what degree. Why it works: It simplifies complex findings into an actionable framework, aligning with executives' thinking about causes, levers and outcomes. Framing: “This isn’t just what we found – it’s how the pieces fit together.”
Make the model the centerpiece of the story. Purpose: Inspire action. How: End the presentation with the model as a strategic map, pointing out which levers are most useful, where to focus resources or how to position the offering. Why it works: People remember stories with structure. A well-crafted model becomes both the story arc and the decision guide. Close with: “Here is the model of how this market works – and here’s what it tells us to do next.”
Powerful tools
Models form the backbone of knowledge creation across scientific disciplines. In marketing research, they serve not as endpoints but as structured frameworks for explaining and understanding marketing phenomena. When integrated with managerial experience and insights from adjacent fields, such as behavioral economics or operations, they become powerful tools for shaping research hypotheses, interpreting results and translating findings into actionable strategy.