The best of all worlds?
Editor's note: Greg Mishkin is vice president, communications at Market Strategies International, an Atlanta research firm.
Big data is changing the way businesses view market research. The magnitude of the data now available is so enormous and detailed that some predict it will lead to the extinction of traditional market research methods. Our firm rejects the notion that big data will make traditional research obsolete. Instead, we believe that integrating traditional research methods with big data analytics provides an exceptional opportunity to understand what customers are doing, why they are doing it and, most importantly, what can be done to change their behavior.
In this article I will introduce our framework for combining qualitative and quantitative methods with big data analytics and classic experimental design to systematically address a myriad of business challenges. A case study involving AT&T Mobility will illustrate how the successful marriage of big data and traditional research can optimize traditional customer experience research. And the example of a hypothetical research plan to transform passive brand loyalists into active advocates will further explore the value of employing data analytics in concert with traditional research methods.
Tidal wave of big data
Over the past decade, big data analytics has emerged to address the limitations in both qualitative and quantitative research methods. Today, all activity that occurs on the Internet leaves a tidal wave of big data behind. The “exhaust” from these data is enormous and detailed and provides a precise, unprecedented view of people’s behaviors.
Can a survey of 1,000 consumers or a focus group with a dozen participants possibly compete with billions of data points with virtually no survey bias? Yes. Big data can tell researchers exactly how an individual has behaved, with unprecedented precision and depth. What big data cannot do is effectively tell us the motivations behind actions the way traditional methods can.
Knowing what somebody does is only part of the story. Without a clear grasp of underlying customer motivations, marketers cannot successfully modify customer actions. And to act solely on this limited view of the customer can expose both the company and the market researcher to great risk. The only way to limit the risks of ill-advised business decisions is to use every type of data-gathering tool at your disposal to fully understand your target markets.
AT&T Mobility’s market research team is leading the industry in big data integration. Every day, this complex organization interacts with its millions of customers using hundreds of different makes and models of devices on thousands of rate plans via 2,300 company-owned stores, 4,000 agent locations and hundreds of call centers. All of these customer touchpoints create lots of opportunities for AT&T to either please or frustrate its customers.
This is why identifying which experiences lead to satisfied customers and which lead to dissatisfied customers is so critical. It is the responsibility of AT&T’s customer experience research team to understand the differences in the experiences of satisfied and dissatisfied customers, so that management can take actions to maximize the positive experiences and minimize the negative ones.
One of AT&T’s most critical customer experience research studies is Day in the Life (DIL). Functioning as a primary voice-of-the-customer vehicle, DIL was created to better understand the issues customers may face across various channels when dealing with AT&T and how successfully AT&T is addressing these issues. It also provides important insight into best practices in dealing with customers.
Has limitations
While DIL is incredibly valuable, it, like all research, has limitations. Survey length coupled with some respondents’ inability to accurately recall specifics makes collecting specific and accurate details of these customers’ experience impossible. Additionally, surveying every customer is not feasible, so it is difficult to use such research to target proactive actions to specific customers who might be having suboptimal experiences.
While DIL cannot effectively determine the detailed experiences for every one of AT&T’s customers, AT&T has enormous amounts of data available from every transaction made by each of its customers. This includes data from: point-of-sale; activations and upgrades; direct and indirect marketing; warranty replacement and repair; call centers; chat and online browsing; usage; network performance; billing; and demographics.
Like many large companies, AT&T’s data are stored in dozens of unconnected databases across the organization, making it difficult to see the complete customer experience. To address this, AT&T created ATTain, a platform that brings these disparate data sources together. ATTain also incorporates survey responses like DIL into one data warehouse, allowing an unprecedented view of what customers are actually experiencing.
To understand how this massive data platform works, let’s take the example of Mary, a fictitious customer. When surveyed by DIL, we learn that Mary has had three main issues (billing, equipment, dropped calls), with network problems being her biggest complaint. We see that her problems were not fixed the first time she contacted customer care and that overall she is pretty dissatisfied (giving a rating of 3 out of 10 when asked how willing she would be to recommend AT&T to a friend or relative).
When looking at Mary’s data in the ATTain database, we can see that she has been a customer for only six months, switching to AT&T from Verizon. She is using an iPhone 4 (the one with known “antenna-gate” problems) and there are two other AT&T phones in the household (a feature phone and a Samsung Galaxy 2). She is on a family plan that does not have shared data or text and the data limits on each phone are inadequate for the amount of data the family is using. We can tell that her iPhone’s dropped calls rate is twice as high as the average in her neighborhood. Additionally, we can see that she has only contacted customer care twice (despite reporting more contacts in DIL), once for billing issues and once because of dropped calls. We can also see that she was referred to the warranty department to investigate if there was a device issue causing her dropped calls but she never completed the discussion with the department.
Mary’s DIL responses are critically important, as they are the only insight into how Mary feels about AT&T and how responsive AT&T has been to her issues. Mary’s ATTain data are equally important as it gives insight into details that Mary could never accurately report in a survey. These details allow us to better pinpoint underlying causes of her issues (in this case that her phone is likely causing many of her problems). Combining DIL with ATTain affords an unprecedented view into what Mary is doing, why she is doing it and how this experience is impacting her satisfaction.
While Mary’s example is interesting, the true value is realized when tens of thousands of customers’ experiences are similarly analyzed. Such analysis allows AT&T to detect patterns of behaviors that are indicative of satisfied and dissatisfied customers. Algorithms can then be created to identify these patterns in the ATTain data of all AT&T customers (not just the ones who responded to the DIL survey). As patterns are detected, the satisfaction measures from DIL can be projected onto all AT&T customers, effectively allowing AT&T to identify which customers are at risk of becoming dissatisfied and to take proactive actions to change negative experiences into positive ones.
Nine-step framework
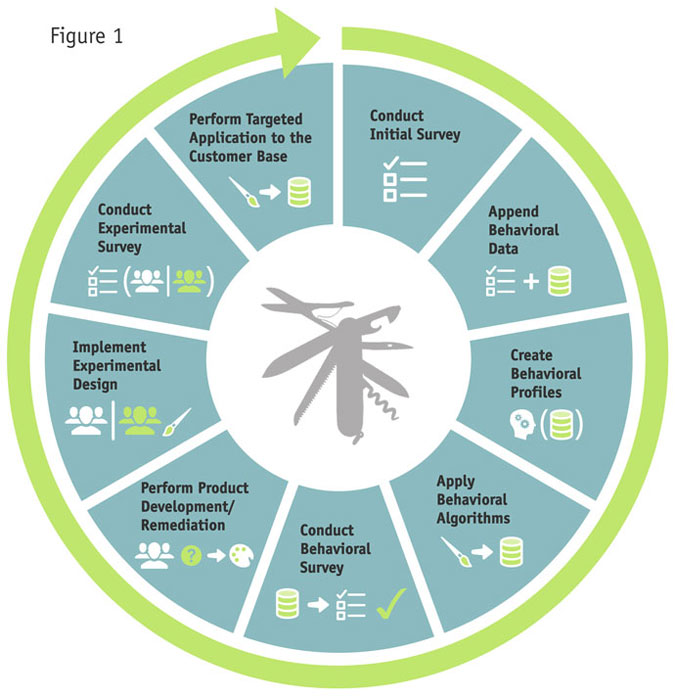
This kind of integration of big data analytics with traditional research can be implemented across industries. Our firm has developed the Continuous Improvement Cycle to do just that. It is a flexible, nine-step framework that does not require rigid application (Figure 1) of each of the steps. In fact, many companies may choose to implement only part of the cycle. AT&T, for example, has implemented the first four steps thus far. However, understanding how all of the steps fit together allows companies to better conceptualize how to get improved utility from their traditional research methods through the integration of data science analytics. As we move through the later steps in the following explanation, we’ll use a hypothetical case of another large telecommunications carrier that wants to use its internal customer data to improve customer experience and decrease churn.

Step 1: Conduct initial survey
The first step is to understand the customer experience from the perspective of the customer. To accomplish this, a quantitative survey of a representative sample of customers can ascertain and quantify satisfaction levels and churn propensity, resulting in crisp, differentiated customer segments that identify which customers are satisfied and which are not.
Research like this is fairly routine and the surveys are, on their own, fairly unremarkable. At AT&T, this research exists in the Day in the Life study. The results can give management an idea of what some of the main issues might be but because the survey is only administered to a small percentage of the customer base, the results cannot be readily used to target solutions to individuals with specific issues. Traditional surveys can give only limited insight to aid marketers in taking concrete actions to modify or encourage individual customer behavior. But this is only Step 1.
Step 2: Append behavioral data
As described earlier, combining observable behavioral data with traditional research can yield much richer insights than either approach independently. Therefore, the next step is to pull together all of the behavioral and transactional data that are available for the customers who responded to the initial survey. At AT&T, this data lives in the ATTain platform but often the data need to be culled by accessing numerous divergent databases throughout the organization. These could include network data, POS data, online usage, customer service, demographics, billing data, seasonality information, store locations and lifetime value as well as activations, returns and exchanges. Once assembled, the data are combined with the customer experience data for the respondents, resulting in a database that contains what the customer did as well as why they did it and how they feel.
Step 3: Create behavioral profiles
This new and far richer database is a good starting point but its use is limited as it only contains data for a small minority (albeit a statistically-representative sample) of customers. To make this database really powerful, it must contain information on nearly all customers. AT&T knows that it clearly is not economically or operationally feasible to obtain customer experience and churn propensity scores by surveying the entire customer base. Therefore, these scores are projected to the entire non-surveyed customer base. To successfully project attitudes, profiles are created that identify the types of experiences and behaviors that are common to each segment and that differentiate segments from each other. Then these profiles are translated into algorithms that assign various behavioral patterns to different groups.
Step 4: Apply behavioral algorithms
Once these behavioral algorithms are created, they can be applied to any behavior pattern, placing individuals into the appropriate segmentation bucket. In AT&T’s case, the algorithms were applied to the behavior patterns of all members of the ATTain platform, attempting to project the segmentation criteria (in this case, customer satisfaction and propensity to churn) to every customer regardless of whether s/he was initially surveyed.
Step 5: Conduct behavioral survey
Next, it is time to optimize. The initial algorithms are sometimes insufficient so we draw a random sample of customers who are flagged to be from the targeted segmentation of “poor customer experience and high propensity to churn” from the entire scored customer base. We then use the same survey instrument administered during the initial survey for this new sample to confirm that the algorithms are accurately identifying these dissatisfied customers. If the survey identifies flaws in the algorithms, then the models may need to be revised or it may even be beneficial to conduct small qualitative analyses to better understand which factors or additional datasets may be missing. It is important to iteratively improve the algorithms until the behavioral survey correctly identifies the targeted segments. By applying the verified algorithms, we obtain a comprehensive database of all of our hypothetical carrier’s customers, containing details of what they did and how they feel.
Step 6: Perform product development/product remediation research
Having a validated and comprehensive database is exciting but it is not enough to simply know which customers are satisfied and which are not. To add meaningful value, the carrier needs to understand what can be done to change these customers’ behavior and increase their satisfaction. Market Strategies has found that qualitative exercises are ideal for deep exploration into what motivates customers to act the way they do. Existing customers that we have confirmed (based on the behavioral survey) to have “poor customer experience and high propensity to churn” can be recruited for qualitative research. Through skilled qualitative moderation, as well as integration of existing innovation/ideation programs, we can identify new products and/or changes to existing products and marketing that are likely to positively impact the customer experience.
Step 7: Implement experimental design
With qualitative research there is always the risk of making significant and/or expensive product changes based on the opinions of too few participants. But using the fully-scored customer database (Step 3), we can now fully test and quantify these ideas by fielding a random sample of dissatisfied and likely-to-churn customers, then dividing this sample into control and experimental groups. It is important to note that, like all experimental designs, the new product or marketing changes should only be presented to the experimental group and not to the control group.
Step 8: Conduct experimental survey
After a reasonable period of time, we then give both the experimental and control groups the same survey instrument used in the initial survey and compare the satisfaction and churn propensity scores for both groups. This determines, with a very high level of certainty, how much greater are the experimental group’s experiences. Once the impact of the new product or remediation has been positively determined, we initiate a classic cost-benefit analysis. If the benefits significantly outweigh the costs, then we can formally recommend the suggested new product or existing product changes to the management team for adoption – knowing, in advance, how beneficial this suggestion will be.
Step 9: Perform targeted application to customer base
Once management approves, the new product or change to existing products and marketing can be strategically applied to the customer base – but not to the entire base. Rather, this change should only be targeted to those customers who are known to be highly loyal but not advocating. Doing so assures that only those customers who have been proven to benefit will be given the change, ultimately maximizing positive impact while minimizing risks.
Maximum amount of impact
At its core, marketing is about action. The main goal of marketers is to drive actions that provide the maximum amount of impact to their organization while minimizing risks, both organizational and personal, associated with these actions. Using a holistic framework like the Continuous Improvement Cycle to integrate traditional qualitative and quantitative research methods with big data analytics can help marketers systematically address a myriad of potential business actions and challenges while maximizing the positive impact to the business and minimizing the risks associated with making ill-advised marketing decisions.