
Measuring the impact
Editor's note: Philip Derham is director, Derham Marketing Research Pty. Ltd., Melbourne, Australia.
 Matrix questions are commonly used in online surveys when several statements, products or services are to be measured on the same scale. For visual economy and for ease in answering, the statement and scale questions are shown as one question. This format has led some researchers to require statement lists in matrix questions to be rotated, to avoid a hypothesized list-order bias. The list-order bias concern is that online survey participants may be more likely to answer the first listed statements and be less likely to answer statements lower on the list.
If the list-order bias hypothesis were valid, it would lessen the information collected, when answering each statement is not compulsory for participants to be able to advance to the next question or screen.
A solution available in online survey software is to rotate the list order, so that all statements on a list are equally advantaged or disadvantaged. This practice assumes the list-order bias hypothesis is valid.
Results from a recent online survey encouraged us to review the list-order bias hypothesis and this article summarizes recent online survey findings about the list-order bias. The initial findings (with caveats) suggest that there is not a list-order bias. Others may wish to review their findings to see if this initial study’s conclusions hold more widely.
Case studies and research practice
The case studies discussed in this article are from online surveys with business, shopping center store and bank customers, recently undertaken by Derham Marketing Research in Australia. As a matter of practice, participants in our online surveys can move from screen to screen without being required to give answers to each question. We use skips, where needed for sequence logic, if a question or statement is not answered.
This practice replicates the freedom to answer or not answer that participants had with paper surveys in the past and enables participants to continue a survey without forcing an answer, in cases where the preset answers do not match the participants’ views.1
Three case studies are analyzed at the all-participants level, regardless of the device on which the survey was completed. A further analysis was then undertaken to see if there were differences in list-question answering if the device used was a mobile (cell) phone rather than a computer or tablet.
1. A business audience case study
The first case study reviewed was of a business audience, in a survey that used a six-statement list and a seven-point rating scale (which included a Don’t know/Can’t say/Not applicable/Not used scale point). The scales used were to assess the value of the services available to the participants, the participants’ satisfaction with those services and whether the participants had recommended the services. The services were shown to participants in this list order: conferences; forums; Webinars; business services; job training; and tertiary education.
Initially, the answers to the statement list did appear to show a list-order effect, as Figure 1 shows.2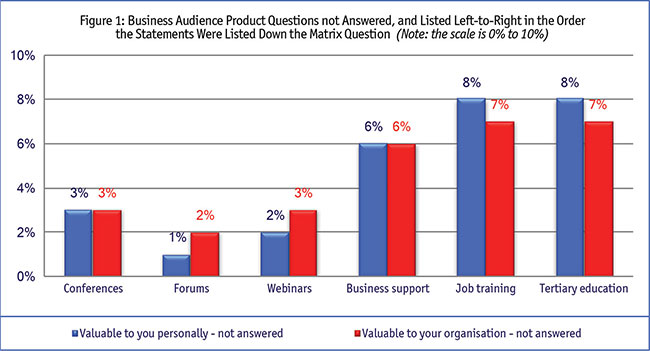
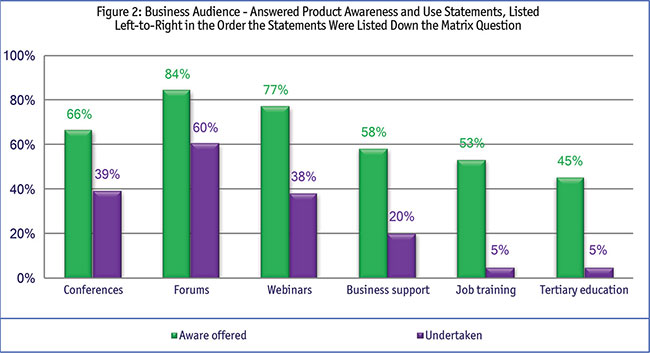
Further analysis suggests the association of not answering a statement in the list may have more to do with whether the participants were aware of the product and whether they had ever used it than with the list order (Figure 2).
These two findings stimulated us to look at results from other online surveys.
2. A shopping center store case study
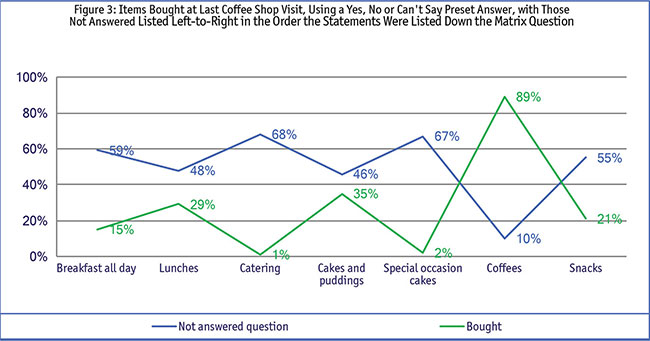
The second case study was of a coffee shop in a shopping center. That survey asked about items bought during the last visit to the shop and used a set, seven-item list – breakfast all day; lunches; catering; cakes and puddings; special-occasion cakes; coffees; snacks – and a three-point scale of Bought, Not bought, and Can’t say.
In the shopping center store study, the not-answered statement relationship seems to be with the numbers of people who had purchased each particular product rather than with list order, the data in Figure 3 suggests. The more people who bought the product, the smaller the not-answered proportion of participants was.3 The coffee example illustrates this clearly – most people bought coffee from the coffee shop, and accordingly, very few did not answer that question.
3. A banking customer case study
Set order matrix questions from bank customer surveys were also reviewed to test the initial findings further. In the bank surveys, customers had been asked to respond to two matrix questions, each of five statements and each with a 12-column Net Promoter Score scale.
The data (Figure 4) show almost all bank customers answered each statement and that few did not answer each statement.
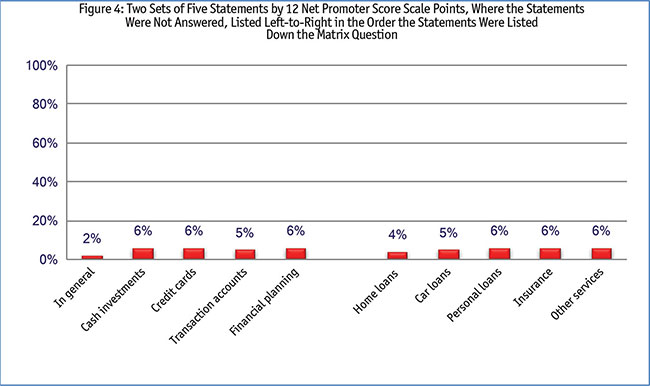
These findings suggest that there was no list-order bias on the more complex 12-point scale, just as there was no list-order bias when the simpler three-point scale was used in the shopping center store survey. This congruence of findings indicates that scale size or scale breadth does not influence participants to answer or not to answer a statement in a matrix question.
Does not appear to influence
These three case studies suggest that a set statement order in matrix questions4 does not appear to influence whether participants answer each statement on the list.
The next step in testing the list-order bias hypothesis was to review the not-answered responses from matrix questions in a survey in which the statement order was randomized.5
The data in Figure 5 suggests that it is the content of the statement, rather than the statement position on the list, that influences whether the statement is answered or not, when the statements are randomized.6 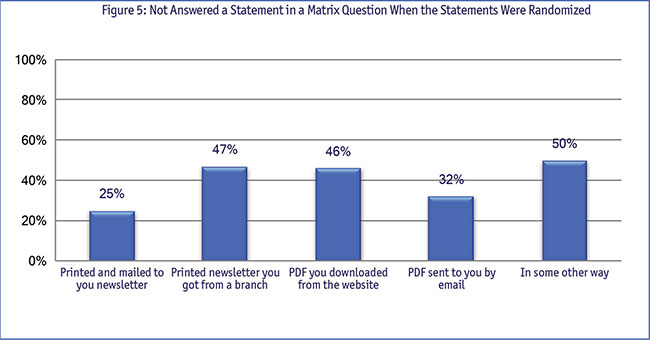
The influence of the devices used to complete the survey
The look of the matrix questions differs when on a computer or tablet screen and when on a mobile (cell) phone though the statement list order remains unchanged. The question then was whether the different question look and smaller screen size of the mobile phone online survey led to list-order differences. There are two main differences in presentation on a computer or tablet when compared with the presentation shown on a mobile phone. The matrix question appears as a matrix question on computers and tablets but on the mobile phone, each matrix list question is shown as a separate question and each statement has its own drop-down answer box.
Also, answering a question on a mobile phone requires two clicks to answer. One click is needed to open the Select descriptor in the panel and a second click is needed to choose the answer. The matrix questions when seen on computers or tablets require only one click per statement to answer it.
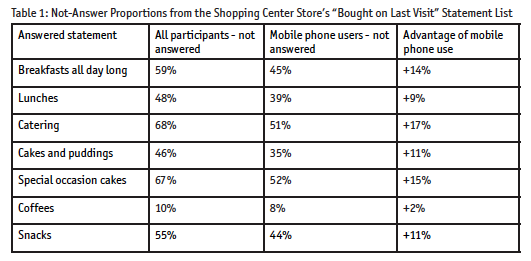
The business audience was too small to usefully analyze (all except 3 percent of the business audience completed the survey on a computer or tablet). The larger shopping center store audience was reviewed and differences between the full sample and the mobile phone sample are shown in Table 1. That data showed that significantly more mobile phone users did answer the three-scale matrix question statements in the mobile phone format than did participants in total.
While this finding suggests there may be advantages in using individual drop-down answers in scale statement questions, data from the banking study is less conclusive.
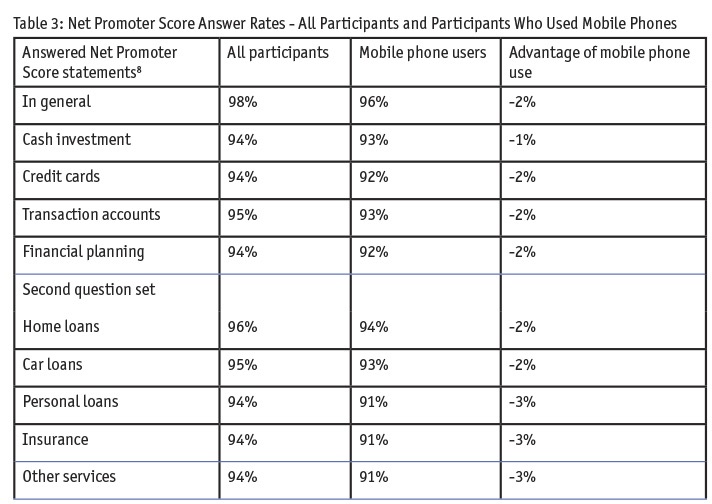
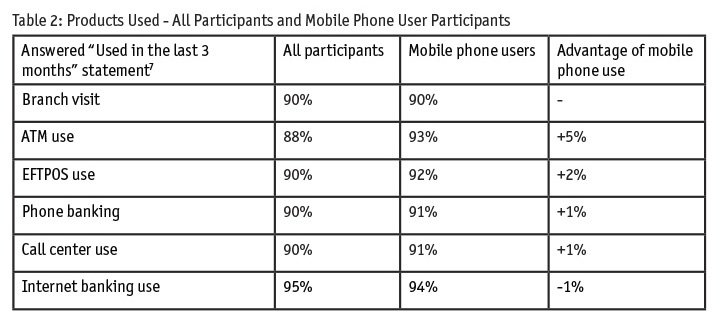 The product use statements (Table 2) could be read to indicate slight support for the shopping center store results (mobile phone users answer list statements more fully than do participants generally) but the findings shown in Table 3 suggest that mobile phone participants are a little less likely to answer list statements than participants generally.
These findings about mobile phone user scale statement response levels in the banking survey are slightly inconsistent and do not offer clear guidance on the not-examined issue of whether matrix scale questions as seen on computers and tablets or matrix questions seen as single statements with drop-down screens on mobile phones are better practice more broadly. Responses from other researchers on this separate issue would be welcome.
What stands out from the shopping center store findings in Table 1 and the bank findings in Tables 2 and 3 is that there was no list-order bias in the not-answered questions among those who answered the survey on a mobile phone. Their answering pattern is consistent with that of participants overall. This suggests that while the visual presentation of the list statements on mobile phones differs from matrix questions seen on a computer or tablet, when the list order is the same, participants respond to the statements themselves, not to the list order.
On balance, then, it seems that surveys completed on mobile phones also do not have a list-order bias.
Conclusions
The preliminary results suggest that there is not a list-order-bias in matrix questions when seen on computers and tablets and that other factors9 influence whether participants answer statements in a matrix question list10 when seen on computers or tablets.
The evidence for or against the list-order bias hypothesis in online surveys completed on mobile phones, when matrix questions are converted to be individual question statements and drop-down answer boxes, is less conclusive. These initial findings still indicate that the list-order bias hypothesis is not substantiated. Findings from other researchers, on the impact of matrix question presentation on mobile phones, are sought.
Our overall conclusion is that this initial study suggests that the list-order bias hypothesis is not substantiated. As a result, there appears to be no need to randomize matrix question statement lists in online surveys.
A secondary conclusion is that matrix question scale points (of up to 12 points) do not influence participants’ decisions to answer or not answer statements. Other factors influence that decision.
Views and evidences from other researchers on this topic are welcomed.
References
1 Nonetheless, in our surveys, most participants answer most questions.
2 The same pattern was noted for the satisfaction and recommendation questions. Data for these questions has not been shown, for space and graph legibility.
3 It is also possible that not answering a statement is a form of answer too. The participant may essentially be saying the statement and/or scales assessing my response to the statement are not relevant to me. This was not tested in the survey, as the scale was assumed to be relevant, but this possibility may be worth further review.
4 With the caveats of a maximum number of seven statements, and the Australian context, noted.
5 The matrix question with the randomized statements asked how customers had read the last issue of the bank’s newsletter.
6 The low level of answered questions and high level of not-answered responses may have been because of low participant interest in a bank newsletter, as a subsequent question found that only 10 percent of bank customers wanted to receive a newsletter from the bank.
7 The two sets of six-statement matrix questions used a six-point scale, which included a Do not have/Did not use/NA answer point.
8 The two Net Promoter Score matrix questions each used a 12-point scale, which included a Can’t say scale point.