Editor’s note: Jonathan Asher is EyeSee’s executive vice president. Asher is based in Minnesota. This is an edited version of a post that originally appeared under the title, “Case study: Planogram optimization during the COVID crisis.”
Author’s note: I use the terms A-brand and top -tier brand interchangeably in this text. To learn more about the study, tune in to our webinar hosted by Quirk’s on the same topic: 3 Paths to Planogram Optimization During the COVID-19 Crisis.
The pandemic has resulted in shortages of ingredients and raw materials, limited plant capacity, supply chain disruptions and changing shopper behaviors. As such, manufacturers and retailers are facing growing pressures – and opportunities – to manage their shelves by rationalizing SKUs, adjusting assortments and resetting planograms.
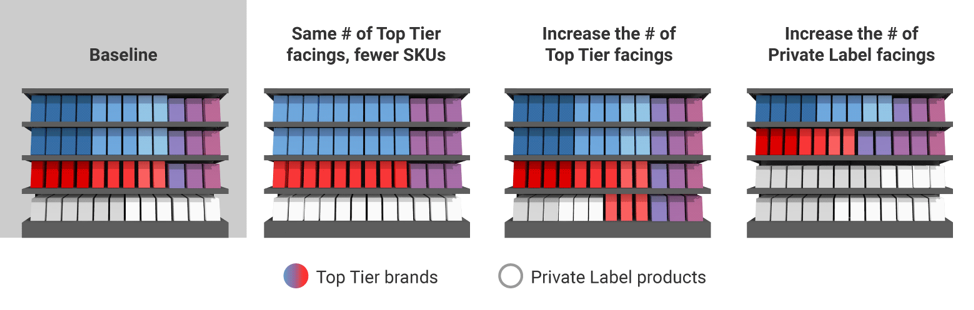
Once it has been determined which items in the branded or private-label line will be eliminated (either temporarily or permanently), the decision must be made as to how to fill the space that will now be made available on the shelf. Essentially, there are three options:
- Display the same number of facings for the top-tier brands with fewer items in the line (so fewer SKUs).
- Replace the lost top-tier SKUs with more facings of private label.
- Replace the lost private label SKUs with more facings of top tier facings.
Which new planogram path is most beneficial?

In order to determine the optimal shelf reset, EyeSee conducted a behavioral shopping study to identify the outcome of adopting the different approaches. The study tested planograms in the coffee, cereal, chocolate and yogurt categories to uncover insights.
We interviewed 1,200 respondents who were split into four cells, and monadically shopped from one of four shelf sets: baseline/control; top-tier brands with same number of facings but fewer SKUs/items; increased number of top-tier facings (replacing private label SKUs); or increased number of private label facings (replacing top-tier SKUs). Each respondent behaviorally shopped four categories: coffee, cereal, chocolate and yogurt.
Should retailers increase the number of A-brands or private label facings?
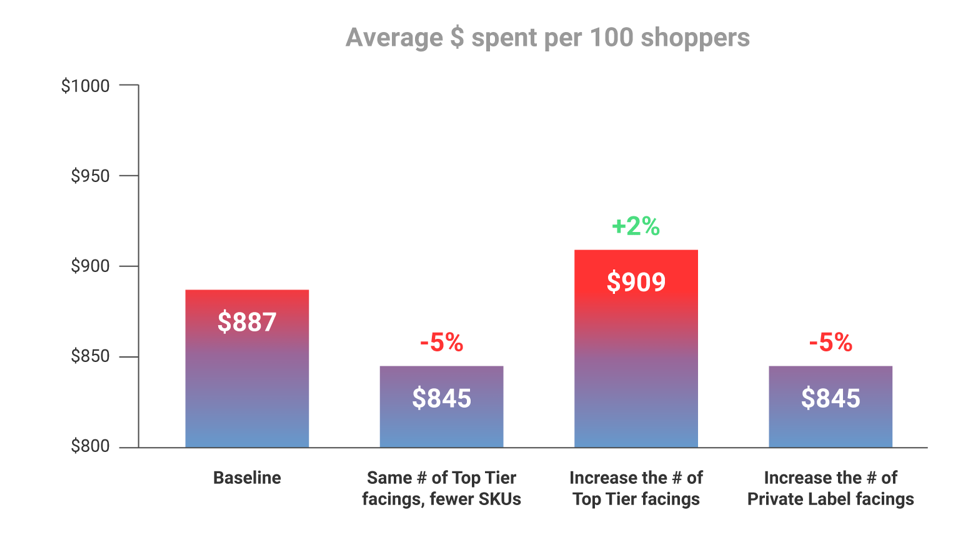
Importantly, even if the number of facings of top-tier brands are maintained, when the number of items are reduced, the number of products bought declines by 2%, and the dollar spend declines by 5% compared to the control shelf. This suggests that replacing those lost SKUs with something else would be a better option.
However, when top tier SKUs are replaced by increasing the number of private label facings, we see that same 5% decrease in spend (compared to the control shelf). This occurs as the total units bought remains about the same, suggesting that the lower price accounts for the change we see.
While retailers may have reasons to place more of their own products on shelf, these findings suggest that doing so will result in significantly lower register rings compared to turning over more shelf space to top-tier brands.
We do see that replacing private label SKUs by increasing the number of A-brand facings, average dollar spend increases by 2% (compared to the control shelf). This occurs as the total units bought remains about the same, suggesting that the higher price accounts for the change we see.
What does this mean for brands and retailers?
The shelf is a zero-sum game in terms of space, but not in terms of efficiency – depending on the objectives, some solutions are clear winners for all parties involved – shoppers, manufacturers and retailers.
Behavioral research on planogram optimization brings us one step closer to those goals by helping us understand the way a busy shelf is seen and shopped – with higher reliability and predictability than if your consumers were to simply tell you what they want on the shelf, or how they think they’d react to a new set up they might encounter at some point in the future.
As we have seen here, when placed in a shopping context and confronted with alternative scenarios, behaviors will often shift, sometimes in unexpected ways. But knowing this before implementation will allow for smart planning and more profitable outcomes.
EyeSee conducted the study in August of 2020. It included over 1,200 respondents split into four cells, who undertook a virtual shopping exercise. The respondents shopped from one planogram option for four categories: Coffee, Cereal, Chocolate and Yogurt.