
Should you gauge your brand performance through NPS?
Editor’s note: Julia Fox is an account manager at The Brandware Group Inc. and Sarah Konkey is a senior research analyst at The Brandware Group Inc. This is an edited version of an article that originally appeared under the title “NPS: A Reliable Measure for Growth?”
We are approaching the 20-year anniversary of the introduction of the Net Promoter Score (NPS). As such, a re-evaluation of this simple and ubiquitous measure is long overdue. Many brands consider NPS the most important measure for growth, but it might be time to take a critical look at its hold on marketers.
What is net promoter score?
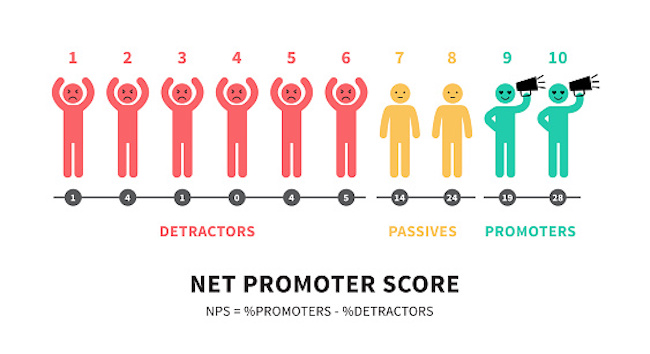
Net Promoter Score made its main debut in a 2003 Harvard Business Review article by Fred Reichheld, “The One Number You Need to Grow” (HBR, 2003). The title offers something enticing to marketers, business managers, advertisers and executives alike – a simple answer to our greatest question. Since then, NPS has become more and more popular, and as of 2020 two-thirds of the Fortune 1000 companies now use it (Fortune, 2020). It’s easy to see why as it’s calculated off one, straightforward question – On a scale of 0 to 10, how likely would you be to recommend [brand X] to your friend or colleague?
Based on the response to this question, detractors answer with a score between 0 and 6, passives answer with 7 or 8 and promoters are those who answer 9 or 10. To calculate NPS, you simply subtract the proportion of detractors from the proportion of promoters.
The fundamental use of NPS is to gauge customer loyalty through their likelihood to refer a brand. This creates the assumption that customer loyalty is directly related to referral intention. We must also assume that referral intention is a robust enough metric to accurately measure customer loyalty. But how sound are these assumptions and is NPS as reliable as we’ve been led to believe?
NPS challenges
Like any single metric, NPS has many constraints when it comes to measurement, interpretation, communication and reliability. From framing and wording to measurement and reporting, there are challenges at each level.
The scale
In his article, Reichheld described the intended meaning behind his scale – “Ten means ‘extremely likely’ to recommend, five means ‘neutral’ and zero means ‘not at all likely.'” From this alone, we can easily argue that we should interpret a score of five as a passive score. In practice, we only consider scores of seven and eight to be passives. In this way, we may be under-calculating passive scores and over-calculating detractors. Reichheld’s intent on limiting promoters to only the top two scores is an understandable reluctance to overestimate loyalty. But the reverse may be occurring by increasing the detractor definition to over 60% of the scale. In this way, we may be overstating the impact of the “detractor” and artificially decreasing NPS, making the score less reflective of actual customer behavior and loyalty.
A difference score
While the simplicity of NPS makes it such an attractive measure, simplicity is also one of its greatest limitations. A calculated metric inherently removes us from the fundamental question and leaves us with ambiguity. What remains is a difference score that has been stripped of the nuance of how it was achieved. This can lead to misdirection and under-information. For example, let’s look at three cases that all result in an NPS of +50.
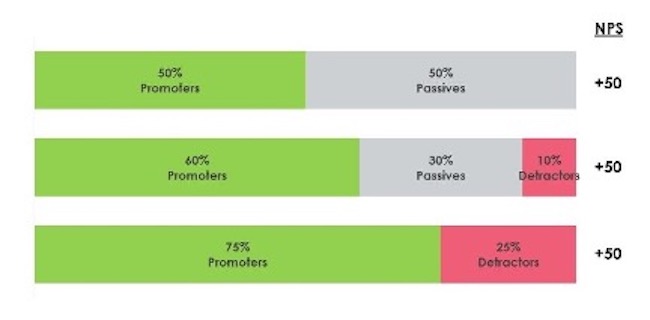
A brand or company may see a steady NPS as a signal of no growth. However, they would be overlooking the critical information that their customer experiences or perceptions have changed dramatically. The further we step away from the data, the more we obscure it.
The net promoter score relationship to growth
As early as 2006, market researchers recognized that overreliance on NPS was a perilous choice. Neil Morgan and Lopo Rego wrote that their “findings clearly indicate that managers should not follow recent prescriptions to abandon customer satisfaction monitoring and focus solely on net promoters as a firm’s only customer feedback metric” and found no measurable relationship between NPS and annual sales growth, gross margin or market share in their peer-reviewed article in the journal Marketing Science (“The Value of Different Customer Satisfaction and Loyalty Metrics in Predicting Business Performance,” 2006).
This is in part because the question at the root of NPS asks customers about their intention, not their behavior. Napoleon Hill once said, “good intentions are useless until they are expressed in appropriate action.” Just because a customer reports that they would recommend a brand doesn’t mean that they do. When they do recommend a brand, it doesn’t always translate into new or more sales. Measuring intention is challenging and is often a poor predictor of actual behavior. This can help explain why NPS is difficult to tie to growth metrics. It can be an excellent way to start digging into customer loyalty but shouldn’t be where we stop.
Even if we consider NPS a measure of customer loyalty and not an indicator of growth, it comes up short. While NPS can help us understand advocacy loyalty, it doesn’t necessarily reflect retention or purchasing loyalty, which extend beyond recommendations. When we understand that customer loyalty is a multifaceted metric on its own, it’s easy to see that NPS can’t function as a stand-alone measure of growth. Reichheld stated that NPS “wasn’t the best predictor of growth in every case” and admitted that it was sometimes “simply irrelevant.” Depending on the industry, product or service and the relationship between the consumer and the brand, NPS has little to no relationship to growth. In our efforts to easily answer the age-old question of how to anticipate growth, we’ve oversimplified to our detriment.
Manipulation
Since NPS is based on an attitudinal question, it’s easy to influence customer responses or which customers are surveyed. Often, brands record NPS scores during or shortly after a customer interaction. It is also common for a third party to conduct NPS surveys during larger brand studies. Forbes reported in 2019 that NPS “results are easy to manipulate” and that some companies “remind only the happiest customers to take the survey” (Forbes, 2019). The who, what, where, when and how of each survey can lead to drastically different responses and affect the NPS.
Net promoter score alternatives
Collecting attitudinal data and attempting to predict and infer behavior from those findings is not the only option. We recommend collecting both behavioral and attitudinal data and pulling insights from more holistic data sets. A single question at the bottom of a receipt or in a follow-up email is simple, easy and inexpensive. But this only provides a narrow snapshot of a much larger, more complex picture. Like the old parable of the blind men and the elephant, we come to incorrect conclusions when we only see a fragment of the overall situation.
Developing business strategies, basing employee bonuses and measuring success based on one metric is both intoxicatingly simple and misguided. Ideally, we must look at the larger picture of the market and how it changes, as well as consumer experience, attitudes and behavior to best understand a brand’s role and impact. Marketing science and the Marketing Accountability Standards Board have found customer satisfaction, brand preference and intention to repurchase to be some of the most effective metrics for growth and brand success over years of study. With a more robust study recording not only NPS but also other loyalty measures such as satisfaction, preference, behavior and intention, we can better understand and predict brand performance.