
Can Detractors also be Promoters?
Editor's note: Julie Wittes Schlack is a consultant and former senior vice president, product innovation at customer agency C Space.
The Net Promoter Score has lost some of its luster. Asking people about their intent to recommend a company or brand doesn’t yield results nearly as meaningful or actionable as does behavioral data about what they’ve actually done. Still, behavioral data is intrinsically backwards-looking and brands rightly hunger for predictive measures. With that in mind, customer agency C Space experimented with combining two measures – one predictive and one retrospective. Using predictive markets supported by the FastFocus market research platform, we found that consumers’ predictions regarding the likely recommendations (and detractions) made by others mapped closely to self-reported behavior measured by C Space’s proprietary Earned Advocacy Scores. This suggests a potentially promising new approach, one that invites consumers to anticipate what brands/products are likely to succeed (or be polarizing) via use of predictive markets, then tracking real-world outcomes using behavioral metrics like purchase data and the Earned Advocacy Score.
In May 2019, Forbes magazine contributor Ron Shevlin unapologetically declared that “it’s time to retire the Net Promoter Score.” His arguments – that NPS fails to take customer demographics into account, doesn’t explain why someone would or wouldn’t recommend a company and, most importantly, that it measures intention as opposed to behavior – echoed those made by a growing number of executives who were increasingly uncomfortable with assessing business performance using such an opaque and unactionable metric.
At C Space we’d been hearing similar misgivings from our clients. As Christina Stahlkopf noted in an HBR Online article (“Where Net Promoter Score goes wrong”), “Increasingly, companies across industries approached us because they were struggling to understand their NPS, laboring to move it or unable to align it with data on customer behavior and wondering why.”
To better understand customer advocacy, C Space launched its own study, testing a new methodology, the Earned Advocacy Score (EAS). In a 2019 survey of 13,175 people and a 2020 survey of 13,926 people, we first asked the standard NPS question about how likely people were to recommend each brand. But it posed two more questions: “Have you recommended this brand?” and “Have you discouraged anyone from choosing this brand?” It also asked respondents to elaborate on the whys behind their responses.
Our goal was not just to learn what people had actually done (versus intended to do) but to capture the nuances in recommendations. After all, people are both complex and astute and what we recommend to whom is deeply rooted in context.
Though NPS assumes that a given individual can’t be both a Promoter and a Detractor, our research revealed that 52% of all people who actively discouraged others from using a brand had also actively recommended it. That’s because, as Stahlkopf notes, “When giving advice on a brand, consumers, like all good matchmakers, consider whether a pairing is right. For example, one person in our study (an NPS Passive) recommended Spotify to his friends for its ease of use and customizability but discouraged his parents from trying it because he felt it was too complicated and too expensive for them.”
But while EAS provides a means of understanding consumers’ past behavior, companies still hunger for predictive measures that can help them optimize their chances for success and avoid costly mistakes. So to support that objective, C Space decided to experiment with prediction markets used in combination with EAS.
Prediction markets use virtual currency and scarcity to mimic a real consumer experience. Participants are given a bank of tokens to invest in the likely success or failure of a group of products, ideas, candidates or brands. They are typically not asked about their own personal preferences but rather about what they think other people are likely to do, i.e., about outcomes, not intentions. Participants invest only in the options about which they have a strong opinion, can invest in the likely failure of an idea as well as in the likely success of one and invest as few or as many tokens as they want based on the strength of their confidence in their own predictions. When they invest, they provide an explanation of why they’re doing it.
Study design
To capture behavioral data (albeit self-reported) we looked at EAS scores for automotive companies (1,889 respondents) and quick-service restaurants (2,115 respondents) captured in our 2020 survey. We then tested eight brands from each of the two categories in two separate predictive markets using a platform provided by FastFocus.
At the start of each market, we asked participants two questions: “Have you recommended any of these brands to people you know?” and “Have you discouraged anyone you know from buying any of these brands?” That enabled us to filter responses on the back end based on these self-reported behaviors.
Then, in the market itself, we instructed participants as follows: “Welcome to the Prediction Market, where we’d like you to anticipate what automotive [or fast-food] brands people are most (or least) likely to suggest to others. Invest as few or as many positive tokens as you want in the brands you think other people are most likely to recommend. Feel free to invest negative tokens in the car [or restaurant] brands you think people would advise others against buying.”
We tested eight brands in each market and each participant had a total of 12 tokens to invest.
Results
First, a quick explanation of the scores shown in Table 1:
- EAS is calculated by subtracting the percentage of respondents who have advised others against a brand from the percentage of respondents who have recommended that brand to others.
- NPS is calculated by subtracting the percentage of Detractors (those choosing a likelihood to recommend of 0-6 on an 11-point scale) from the percentage of Promoters (those choosing a likelihood to recommend of 9 or 10 on an 11-point scale).
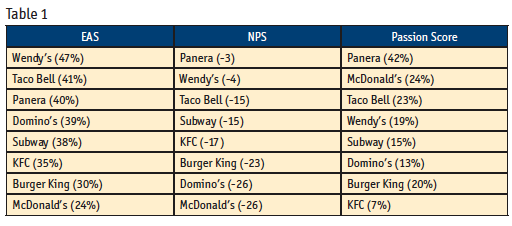
The FastFocus Passion Score captures the percentage of customers who are passionately positive about an idea or prediction and is calculated using a proprietary algorithm that considers the number of tokens available to be invested, the number of ideas/predictions and the investment patterns of individual respondents.
In the quick-service restaurant market (N=142), the rankings were generally similar but with one notable difference in the Passion Score for McDonald’s.
In the EAS data, Wendy’s had the highest score, followed by Taco Bell and Panera. The NPS data showed these same three brands in the top three (along with Subway) but with Panera coming out on top rather than Wendy’s.
In the FastFocus prediction market, Panera not only came out as No. 1 but earned an exceptionally high Passion Score of 42%. As with the other two measures, Taco Bell also emerged in the top three. But unlike the other two measures, McDonald’s landed in the top three as well in its Passion Score.
Why did McDonald’s perform so well in the Passion Score as compared to either EAS or NPS? The Passion Score adds a potentially useful nuance, as it helps both to identify brands about which respondents are especially partial and to identify brands that may not be universally beloved but have a cadre of hardcore loyalists. That’s because it measures grades of promotion quantitatively (in the number of tokens invested) as well as qualitatively, with verbatims providing rich rationale as they do in the EAS. 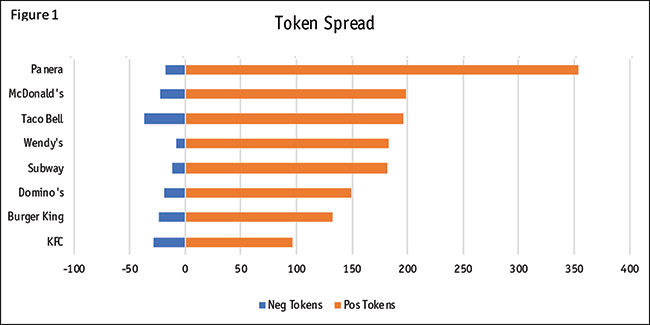 These nuances are reflected in the token spread in the prediction market (Figure 1), which shows how tokens were allocated, positively and negatively, across the brands being tested.
Panera garnered so many tokens because it had the highest number of positive investors (100), the fewest number of negative investors (7) and the highest average investment (3.53).
Similarly, McDonald’s outperformed some other brands in the prediction market, largely on the strength of the question being asked – not “What do you like?” or “Have/would you recommend?” but rather “What are other people likely to recommend?”
“I don’t care for them much anymore but they’re everywhere and always have been. They also have happy meals and every kid loves happy meals.”
Like the savvy young man who recommended Spotify to his friends but not to his parents, several of those investing heavily in McDonald’s in the prediction market were able to transcend their own personal preferences and draw on their knowledge of other factors that drive recommendations and purchase behavior.
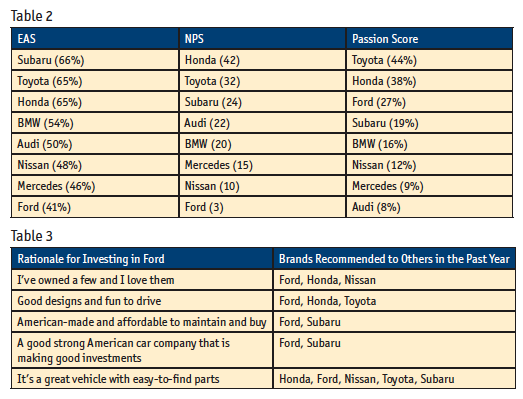
In the automotive market (Table 2) we saw a similar pattern, with a good deal of overlap in the top performers. But just as McDonald’s Passion Scores drove it up in the quick-service restaurant prediction market rankings, similarly robust scores for Ford propelled it higher in the prediction market rankings than in the other two data sets – and for similar reasons. Because the prediction market asked not about personal experience or preferences but rather about what others would do, respondents were able to factor in word-of-mouth reputation and/or service statistics, as illustrated here:
“My family swears by Fords. I have not had one myself but I always hear from people how they never break down.”
Implications
As brands try to better understand and improve their performance drivers, this research suggests some shifts in how they might want to approach metrics.
Focus on behavior in how you measure not just in what you measure. Like the NPS, which classifies most respondents as Promoters or Detractors, the prediction market identifies which brands are polarizing through its token spread chart and passion score. But like the EAS (and unlike the NPS), it is rooted in behavior; it requires people not just to choose a rating scale number reflecting their intentions but to actively invest for and/or against specific brands. And because they are doing so in the context of scarcity, i.e., because they have a limited number of tokens to invest, we can assume that these investments carry greater cognitive and emotional weight.
Cast a wider net beyond personal preferences. Unlike either metric, prediction markets ask not about personal behavior or intention but about what real-world outcomes respondents anticipate based on knowledge about trends, the category, the brand and word-of-mouth.
“I’ve never had [Panera] but people are starting to eat healthier so think it’s a good [investment].”
“I’m not too familiar with Panera as much as I would like. It’s been recommended to me by friends and family.”
In both of these cases, it is safe to assume that given their lack of personal experience, these respondents would have given Panera a “likelihood to recommend” score in an NPS survey of less than 9, making them Neutrals or Detractors. But just as the EAS enables people to report on their actual behavior, the prediction market lets them make informed guesses as to the behavior of others, independent of their own experience.
Employ multiple metrics to get a more holistic view. Just as prediction markets echo NPS in reflecting which brands/products are especially polarizing, they echo the EAS methodology in recognizing the weight of behavior. That becomes evident when we filter Passion Scores to look at just those individuals who have recommended a given brand in the past.
For example, Toyota (which had a No. 1 or No. 2 ranking in every methodology employed) had a Passion Score of 44% and an Idea Score of 203. (The Idea Score indicates how broadly embraced an idea or prediction is, with a score of 100 represented as an average. Thus a score of 203 is 103% higher than average.)
But when we filtered on just the subset of respondents who had actually recommended a Toyota to others in the past, its Passion Score increased to 77% and its Idea Score to 330. While this correlation isn’t surprising, it does reinforce the notion implicit in the EAS, which is that past behavior is likely a better predictor of attitudes and future behavior than the more abstract question of “likelihood” to recommend.
Because NPS only effectively deals with extremes (Promoters and Detractors) EAS is potentially a better measure of post-sales preferences and influences. Coupled with the Passion Score (which adds the element of scarcity and effectively ignores the detractors), it may provide a fuller, more actionable picture of how consumers will act.
As an example, let’s look again at the automotive data. Without the Passion Score, Ford would infer it has a problem. Despite a 41% EAS, it is the lowest-ranked brand. But layering in the Passion Score (27%) provides Ford with the metric it needs to understand that a subset of people feel strongly positive in relation to the brand.
In this way the Passion Score coupled with the EAS can provide more granularity between what NPS would classify as Neutral and Promoter with respondents who were passionate enough to invest multiple positive tokens (and/or to recommend Ford to some of their friends).
Use recommendations (for and against) to better understand the competitive landscape. When we filtered prediction market data on just the subset of respondents who had advised others against a specific brand, we got some interesting insights into the competitive landscape. For instance, those who advised against lower-priced cars like Toyota did not award the highest Idea Scores to premium brands like BMW or Mercedes. Rather, they favored brands that are comparable in terms of price and features (e.g., Subaru). Those who advised against Fords gave Nissan and Toyota the highest scores, thereby confirming who each of these brands’ most likely competitors are.
But there are other lessons to be learned from Detractors as well. For example, those who had advised others against luxury brands like Mercedes and BMW gave the highest Idea Scores to Toyota, suggesting that the latter may have greater opportunities to make inroads into the traditional luxury market. Those who had recommended that others avoid McDonald’s gave Taco Bell an overwhelmingly high Idea Score but showed respect for Wendy’s and Burger King as well, suggesting that their antipathy to McDonald’s doesn’t necessarily signal opposition to burgers in general.
We also got a better understanding of the competitive landscape by focusing on those respondents who were positively passionate and saw interesting patterns even when price was not a big factor. For example, in the quick-service restaurant prediction market, while those who had recommended Panera in the past also gave it the highest overall Idea Score, Wendy’s came in a close second and vice versa. By seeing which other brands are appealing to their most devoted consumers, each of these brands can learn how to further enhance their menus and/or messaging.
The automotive market also yielded a richer understanding of the competitive landscape when we focused on the relationship between prediction market investment behavior and real-world recommendations via EAS. For example, when we looked at the middle range of Promoters (those allocating three positive tokens to Ford, where the maximum investment was seven tokens), we saw that 58% had recommend Ford (along with Subaru, Toyota and Honda) – the top brands in our EAS data. The verbatims shown in Table 3 revealed why.
While our sample sizes are small, these findings whet our appetite to further explore how EAS and prediction markets together might help brands better understand the competitive landscape – their vulnerabilities, opportunities and the consumer word-of-mouth that drives both.