Editor's note: Stephen Hellebusch is president of research firm HellRC.
In analyses examining a simple correlation – r – the Pearson product-moment coefficient is calculated and one does not typically have occasion to examine a total and then subsets. In most situations examining the r, the scatter plot and the regression line associated is considered sufficient, though perhaps also testing to determine the level of significance of r from zero.
But in recent work on arbitrary coherence, the author developed a number of questions about the nature of a specific task and explored them.
In arbitrary coherence (Ariely, Loewenstein and Prelec, 2003), the impact of a number that respondents know to be unrelated and randomly selected (as in question one, Q1, below) affects the group’s willingness to pay (WTP, as in Q3). In the original article, the authors found strong simple correlations between the answer given to Q1 and the WTP in Q3 for six of six items. All correlations were statistically significantly different from zero (p < 0.05). Further evidence of the effect came from breaking the data into quintiles based on Q1 and examining the WTP across these five groups. The average WTP rose as the arbitrary number from Q1 rose, with very few exceptions.
In recent testing (Hellebusch and Mattei, 2018), the author looked for arbitrary coherence by asking three questions:
- Please write the last two digits of your primary telephone number as if it were a price in dollars. For example, if your primary telephone number is 555-721-1701, you would put $01. If it is 555-721-0171, you would enter $71.1
- In Column B, indicate if you would be willing to pay that amount for the item by writing in a Y for “yes” or an N for “no.”
- In Column C, pretend there is an auction for the item. In whole dollars, write in the maximum amount you would be willing to pay for it.
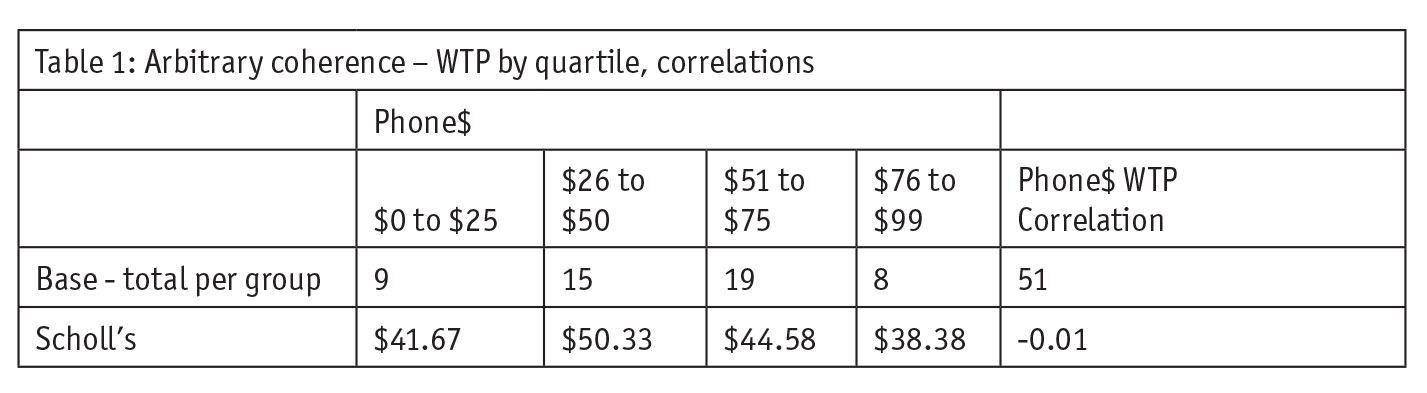
The “item” in question in these data was a labeled picture of Dr. Scholl’s hand-stitched leather loafers; it was selected at random from a newspaper advertisement to test for the arbitrary coherence effect. The effect is measured looking at the correlation between the Q1 and Q3, the WTP responses. A second way is arraying the data in quartiles or quintiles based on Q1 responses and observing the WTP responses within those subgroups. If arbitrary coherence is present, the WTP should rise as the “Phone$” subgroups (the arbitrary numbers) rise. Table 1 shows what happened with the Dr. Scholl’s Loafers.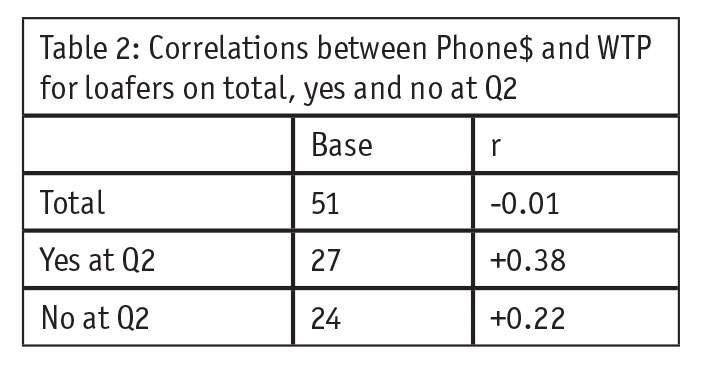
Basically, no arbitrary coherence effect was found. The correlation was near zero and the WTP dollars rise and then fall across quartiles.
But what if the response to Q2 (willingness to pay the arbitrary amount) would make a difference in the WTP responses? What if the 27 who said they would buy it for the arbitrary price showed coherence but the 24 who said they wouldn’t did not? Since the base sizes of 27 and 24 are too small to create reasonably-sized quartiles, the correlation coefficient was the measure of interest.
 Both of the Yes/No subgroup correlations were positive and higher than the correlation based on the Total. Somewhat naively, the author had expected correlations to be like means, where if one subgroup mean was much lower than the mean on total, others must balance it out by being higher. In this case, it looks like the parts are greater than the whole!
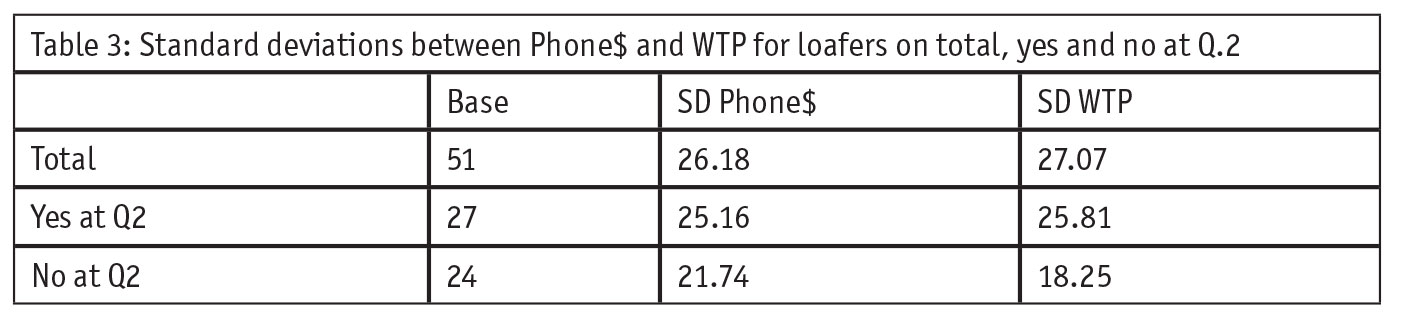
A bit of exploring to understand this effect found that the correlation is equal to the covariance between X and Y divided by the standard deviation of X times the standard deviation of Y. In these data, the covariances were -11 on Total, 244 on the Yes subgroup and 88 on the No. The standard deviations were similar between the Total and the Yes subgroup but a bit lower for the No.
So, the reasons that subgroup correlations can be much higher than the total are both because the covariance can be quite a bit higher in the subgroups and/or because the standard deviations can be lower. The latter is less surprising than the former for the author, primarily due to a greater familiarity with variability than with co-variability.
Net, the conclusion for work in arbitrary coherence is that correlation coefficients are not a very good measure to rely on in exploring the phenomenon, since a shift which should have a minor impact greatly changes the results.
Footnote
1 Ariely, et al., used the last two digits of respondents’ Social Security numbers, written as dollars, for the random digits. The author’s research was online, so the first question was changed to remove any concern about respondent privacy.
References
Ariely D., Loewenstein G. and Prelec D. (2003). “Coherent arbitrariness: Stable demand curves without stable preferences.” The Quarterly Journal of Economics, February.
Hellebusch, S.J., and Mattei, M.D. “Arbitrary coherence and image perception in a national sample.” Presented at MMA Conference, April, 2018.