
Depends on how you ask
Editor's note: Terry Grapentine is an independent marketing research consultant. The author thanks Brian Kiley, Christopher Meyer, David Soorholtz and R. Kenneth Teas for helpful comments on earlier drafts of this article.
 This article presents an argument for not measuring the concept of customer satisfaction as researchers typically measure it: by using a direct rating scale such as the typical 0-10, very dissatisfied to very satisfied scale. (For purposes of discussion, I refer to that scale as the satisfaction scale.) The article’s fundamental premise is that the satisfaction scale is too ambiguous to be used as a good summary measure of a respondent’s overall affective, i.e., emotional, response of varying intensity to a brand.1 This is because consumers who are identical in their beliefs, needs, wants and evaluation of a brand can give widely different answers to the satisfaction scale, based on their interpretation of the term satisfaction. 2
This article is organized as follows: satisfaction is an ambiguous concept; the marketing literature does not offer a uniform definition of the satisfaction concept; satisfaction can be an emotion; satisfaction can be a cognition; and, how to approach the satisfaction concept in applied research. 3
Satisfaction is an ambiguous concept
An ambiguous concept is one having more than one distinct meaning. In the sentence “We saw her duck” duck could refer to the quacking animal or to the action of lowering one’s head or body.
Is satisfaction an emotion or cognition? Some respondents interpret satisfaction as an affective (i.e., emotional) response to a brand, others as a cognitive response. A cognitive process is the “mental action or process of acquiring knowledge and understanding through thought, experience and the senses.” 4 For example, some respondents answer the direct satisfaction rating scale with respect to how they feel about a brand (e.g., terrible/delighted, don’t like/like very much) and others answer with respect to some cognitive process (e.g., the brand performed better than anticipated, the brand performed as advertised).
What is the respondent’s focus when answering the satisfaction scale? Different respondents may focus on different aspects of their experience with the brand, adding to the term’s ambiguity. For example, some respondents may focus on their consumption experience while others may focus on the ease or hassle associated with purchasing the brand. The former may occur if you interview a consumer who has been using a brand for an extended period of time. The latter may occur if you interview a consumer near the time a brand purchase was made.
Additionally, the respondent’s focus may entail “comparing [brand] performance to some standard.” 5 For example, one respondent may answer the satisfaction scale based on brand performance relative to how the respondent forecasted the brand would perform, while another responds based on how the brand compares to her ideal brand.
What is the respondent’s time reference when thinking about brand satisfaction? Different respondents may answer the satisfaction scale based on their most recent brand experience while others may give a brand rating based on their overall experience with a brand since its purchase (see Table 1). Respondent 3 references the time when he was bargaining over the vehicle’s price, while Respondent 2 is thinking about her overall experience with the vehicle.
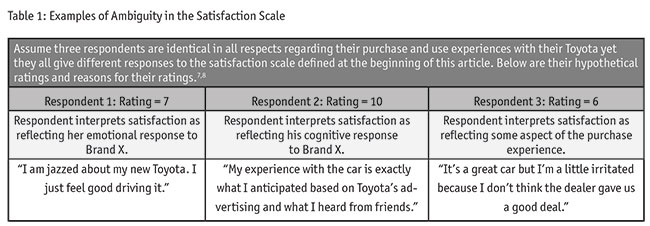
In summary, using the data from Giese and Cote,6 Table 1 gives examples of how three identical, hypothetical respondents can answer a satisfaction scale differently, based on their interpretation of the term “satisfaction.” Questionnaire wording might reduce some of the ambiguity of the satisfaction scale (e.g., having Respondent 3 rate the brand based on his experience with the vehicle after purchase) but factors such as whether respondents answer the satisfaction scale based on emotion or cognition will always be present.
The marketing literature does not offer a uniform definition of the satisfaction concept
In answering the question, “What is customer satisfaction?” the marketing literature provides little guidance. In a 1997 review of the marketing literature, former Vanderbilt University business professor Richard L. Oliver’s book, “Satisfaction: A Behavioral Perspective on the Consumer,” found a mishmash of definitions and descriptions of the customer satisfaction concept in the literature, prompting him to proclaim, “Everyone knows what [satisfaction] is until asked to give a definition. Then it seems, nobody knows.” 9
In short, the field of marketing has not reached agreement on a consistent definition of the concept of “customer satisfaction.” Further, marketers do not even agree what to call this concept. Should it be called “customer satisfaction,” “consumer satisfaction” or just “satisfaction”?
I refer to the concept as “customer satisfaction” because that is the term most often used in applied marketing research articles on this topic, based on a search of all three terms in Quirk’s marketing research article database.
Satisfaction can be an emotion
Giese and Cote conducted one-on-one, in-person interviews with 23 respondents and asked them to define the term “satisfaction” and elaborate on its meaning.10 Respondents’ answers fell into two broad categories – 77% were affective in nature and the remaining were cognitive, reflecting the ambiguity of the concept. See Giese and Cote’s article for a more complete discussion of their interview script.
Affect is a term denoting an emotional response. For example, when talking about being satisfied with a given product, respondents’ affective responses reflect comments such as the product makes me “happy,” “like it” or “comfortable.”
Researchers have attempted to measure satisfaction as an emotion by operationalizing customer satisfaction measures reflecting variance in emotional intensity by using scale anchors such as the following:11 terrible/delighted; displeased/pleased; disgusted/contented; tense/elated; bad/good.
The choice of scale anchors depends on the product category and the context of the question being asked. For instance, scale anchors “delighted/terrible” might be the kind of emotion appropriate for measuring the affective response experienced by a recent cruise line customer to an exotic Caribbean port of call but likely not the affective response experienced by a person who purchased a toner cartridge for a printer, for which scale anchors “I like/don’t like this toner cartridge” may be more appropriate.
Satisfaction can be a cognition
In contrast to an affective response, a cognitive response is one reflecting a mental (non-emotional) product evaluation. For example, when talking about being satisfied with a given product, respondents’ cognitive responses reflect comments such as “The product works in the way it was advertised,” “It had all the features I wanted” or “The product just does not break.”
One excellent example of a cognitive based model predicting customer satisfaction is Gilbert A. Churchill Jr., and Carol Surprenant’s classic 1983 Journal of Marketing Research article, “An investigation into the determinants of customer satisfaction.” The authors describe and test…
“…the disconfirmation paradigm, which holds that satisfaction is related to the size and direction of the disconfirmation experience, where disconfirmation is related to the person’s initial expectations. More specifically, an individual’s expectations are: (1) confirmed when a product performs as expected, (2) negatively disconfirmed when the product performs more poorly than expected and (3) positively disconfirmed when the product performs better than expected. Dissatisfaction results when a subject’s expectations are negatively disconfirmed.”12 Satisfaction results when a subject’s expectations are positively disconfirmed – the customer received more than what was expected.
Figure 1 gives a simplified version of their model. I do not discuss in much detail how this model is estimated or the questionnaire used to create the model. That information can be found in the Churchill Jr. and Surprenant article, a link to which the endnotes supply.
The model is built around a consumer’s purchase of a hybrid plant (a chrysanthemum). The model’s terms are defined below.
Pre-purchase expectation: Perceived expectation of product performance (e.g., expected number of flowers on the plant). In Churchill Jr.’s experiment, respondents read written messages about this product, which created product performance expectations in their minds. In an actual setting, advertising or word-of-mouth can create pre-purchase expectations.
Post-purchase perceived performance: Perceived product performance (e.g., respondent perceptions of the number of flowers on the plant, ranging from “many blooms” to “few blooms”).
Disconfirmed expectation: “Disconfirmation arises from discrepancies between prior expectations and actual performance.”13 This was measured by the scale, My expectation of the number of flowers was: Worse than I thought, Accurate or Better than I thought.
Satisfaction: Churchill Jr. and Surprenant used a multi-item scale to measure this concept. For example, one measure they used was a seven-point scale ranging from I like the plant to I dislike the plant.
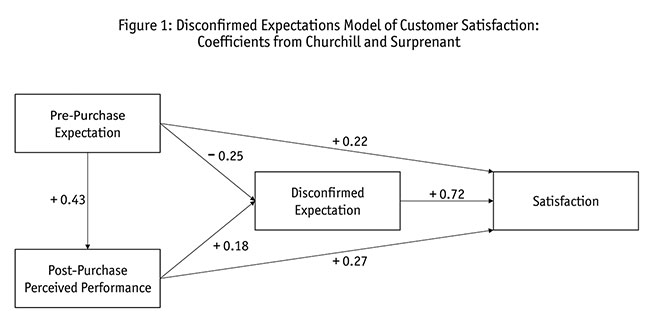
The arrows in Figure 1 denote the functional relationships among the model’s variables (e.g., Disconfirmed Expectations predicts Satisfaction). The coefficients (like standardized regression coefficients in a multiple regression equation) are derived from a structural equation model, reflecting the influence one variable has on another. For example:
- The arrow from pre-purchase expectation to post-purchase perceived performance: The coefficient is positive 0.43. All other factors held constant, a positive/negative change in pre-purchase expectation is associated with a positive/negative change in post-purchase perceived performance. To generalize, raise consumers’ pre-purchase expectations for your product and they may be inclined to believe your product performs better than they would otherwise.
- Pre-purchase expectations to satisfaction: The coefficient is positive 0.22. All other factors held constant, a positive/negative change in pre-purchase expectation is associated with a positive/negative change in satisfaction. This suggests raising consumers’ pre-purchase expectations may positively impact satisfaction.
- Pre-purchase expectations to disconfirmed expectations: The coefficient is negative 0.25. All other factors held constant, a positive/negative change in pre-purchase expectation is associated with a negative/positive change in disconfirmed expectation. The study suggests raising consumers’ pre-purchase expectations may lead to a negative change in disconfirmed expectations. Raise consumers’ expectations and they may be more disappointed in the product’s performance relative to what they expected.
- Post-purchase perceived performance to disconfirmed expectations: The coefficient is positive 0.18. All other factors held constant, a positive/negative change in post-purchase perceived performance leads to positive/negative change in disconfirmed expectation. Increasing consumers’ perceptions of a product’s perceived performance is associated with positively increasing their disconfirmed expectations. Consumers feel they are getting more than they bargained for.
- Post-purchase perceived performance to satisfaction: The coefficient is positive 0.27. All other factors held constant, a positive/negative change in post-purchase perceived performance leads to positive/negatives changes in satisfaction.
- Disconfirmed expectation to satisfaction: The coefficient is positive 0.72. All other factors held constant, the more consumers’ disconfirmed expectations increase/decrease, the more satisfaction increases/decreases.
In summary, you can readily see why this definition of satisfaction reflects a cognitive process. Consumers, consciously or subconsciously, compare expected vs. perceived product performance vis-a-via relevant product attributes in determining their satisfaction with a product.
How to approach the satisfaction concept in applied research
For the reasons stated here, I do not recommend using the satisfaction scale in many cases because of the inherent ambiguity of the term satisfaction. Nevertheless, I encourage you to read Giese and Cote’s (2002) article to learn about their recommended framework for measuring the satisfaction concept in case you have an appropriate application for this concept in the future. Consequently, my recommendations, in the context of understanding brand choice, are as follows: 1) recognize that brand decisions always have an emotional component; 2) consider the nature of the dependent variable you want to measure – often, measuring brand loyalty is more useful than measuring satisfaction; 3) use multi-item measures; and 4) conduct measurement validity and reliability tests of your survey measures. Some of these recommendations touch on complex issues that are beyond the scope of this article, so I provide references for the interested reader.
Brand decisions always have an emotional component. Over the past decade, neuroscience has discovered that all human decision-making, not just brand selection, involves emotions.14 Consider the neuroscientist Antonio Damasio and his patient “Elliot.”
“Previously a successful businessman, Elliott underwent neurosurgery for a tumor and lost a part of his brain – the orbitofrontal cortex – that connects the frontal lobes with the emotions. He became a real-life Mr. Spock, devoid of emotion. But rather than this making him perfectly rational, he became paralyzed by every decision in life.”15
David Eagleman, Guggenheim Fellow and Stanford University adjunct professor of neuroscience, recounts a similar story of Tammy Myers:
“…a former engineer who got into a motorcycle accident. The consequence was damage to her orbitofrontal cortex, the region just above the sockets of the eyes. This brain region is critical for integrating signals streaming in from her body – signals that tell the rest of the brain what state her body is in: hungry, nervous, excited, embarrassed, thirsty, joyful [i.e., her emotional state] …. Because she can no longer read her body’s emotional summaries, decisions become incredibly difficult for her.”16
The implication of these findings is that any measure attempting to capture the intention of a consumer to purchase one brand over another should include at least one measure of emotion. For an example, see discussion below under “Use multi-item measures.”
Consider the nature of the dependent variable you want to measure. Often, researchers want to know what predicts satisfaction – i.e., what brand performance ratings predict the satisfaction scale. In many cases, the better construct to predict is brand loyalty. This is because consumers do not always purchase a brand they have been satisfied with, for example, because their needs are changing (e.g., buy a minivan because of a growing family), they are in a better economic position to purchase a higher-quality product or perhaps they just want to try a different brand. Other measures you might consider that are better predictors of brand loyalty are the following: a brand I will not/will consider in the future; a brand I would not/would recommend; or, I consider myself not/very loyal toward this brand. Note that any measure of a loyalty concept should be measured with multi-item scales, as discussed next.
Use multi-item measures. The classic article to read about this topic is Gilbert A. Churchill Jr.’s 1979 Journal of Marketing Research article, “A paradigm for developing better measures of marketing constructs.”17 For now, refer to Figure 2. In it, F1 denotes the loyalty construct. It is measured by three items, one measuring a doctor’s brand purchase intentions for a vaccine product (q20 – How likely are you to continue using Brand X over the next two years? Not at all likely/Very likely); a second measuring the likelihood a doctor would recommend the brand in the future (q21 – If asked by a colleague, I would not/would recommend this brand); and, a third measuring affect, using the scale anchors I have a neutral/positive feeling about this brand (q22). 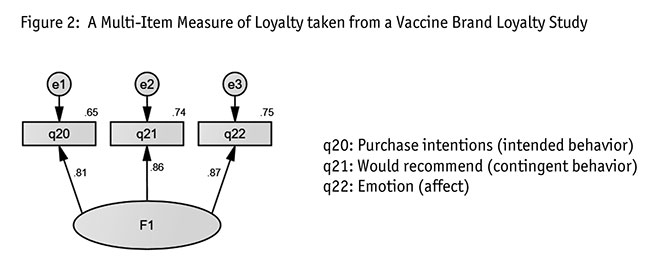
The arrows denote the relationship between the loyalty construct (F1) the error variance terms (e1, e2 and e3) and the three measures. The variance in q20, q21 and q23 is caused by F1 and the error terms. The coefficients from F1 to each of the questions reflect the strength of the association between the loyalty construct and the three multi-item measures. A coefficient is considered “good” if it is 0.70 or greater.
Why measure loyalty with three (or more) items vs. one? Churchill Jr. says:
“Multi-item measures have much to recommend them. First, individual items usually have considerable uniqueness or specificity in that each item tends to have only a low correlation with the attribute being measured and tends to relate to other attributes as well. Second, single items tend to categorize people into a relatively small number of groups. For example, a [7-point scale] can at most distinguish between seven levels of an attribute. Third, individual items typically have considerable measurement error; they produce unreliable responses in the sense that the same scale position is unlikely to be checked in successive administrations of an instrument.”
Consider the imprudence of using a single attribute rating to measure concepts such as loyalty or even “likelihood to recommend,” as discussed by Jacob Jacoby:
“How comfortable would we feel having our intelligence assessed on the basis of our response to a single question? Yet that’s exactly what we do in consumer research . . . . The literature reveals hundreds of instances in which responses to a single question suffice to establish the person’s level on the variable of interest and then serves as the basis for extensive analysis and entire articles.
. . . Given the complexity of our subject matter, what makes us think we can use responses to a single item . . . as measures of these concepts, then relate these scores to a host of other variables, arrive at conclusions based on such an investigation, and get away calling what we have done ‘quality research?’”18
I highly recommend reading Churchill Jr.’s article because it gives you a framework for developing multi-item scales and how to assess their validity.
Conduct measurement validity and reliability tests of your loyalty construct
Based on personal experience, if you are currently using the satisfaction scale and you want to switch over to a multi-item measure of a new dependent variable to take its place, test your new multi-item scale thoroughly before deploying it. I recommend the following: 1) use procedures outlined in the Giese and Cote article; conduct exploratory research to understand what emotions and cognitions are linked to your dependent variable, e.g., brand loyalty; 2) conduct quantitative testing of alternative multi-item measures of your dependent variable to assess their quality (refer to Churchill Jr.’s article on how to do this); 3) finally, repeat 1) and 2) periodically to assess the reliability of your multi-item scale over time.
Measure an ambiguous concept
The commonly used satisfaction scale defined at the beginning of this article seeks to measure an ambiguous concept. Different respondents interpret the term satisfaction differently. Respondents interpret the rating scale variously as reflecting an emotion, a cognition, different points in time or a different focus (e.g., expectations, product benefits, consumption experience).19
One may counter that marketing researchers use many terms in their surveys possessing various levels of ambiguity or vagueness – so what’s the big deal? As social scientists seeking truth, we need to be concerned with the accuracy and precision of the language we use in our questionnaires and the statistical models that are derived from them. We cannot eliminate ambiguity or vagueness from these terms but we can strive to reduce them.
References
1 Giese, Joan L., and Joseph A. Cote (2002). “Defining consumer satisfaction.” Academy of Marketing Science Review, Volume 2000, No.1, pp. 1-24. Available: https://www.researchgate.net/profile/Joan_Giese/publication/235357014_Defining_Consumer_Satisfaction/links/5419a5790cf203f155ae0afb/Defining-Consumer-Satisfaction.pdf
2 Giese and Cote (2002), p. i.
3 My argument is based on Giese and Cote (2002).
4 Wikipedia (nd) Available: https://en.wikipedia.org/wiki/Cognition
5 Giese and Cote (2002), p. ii.
6 Giese and Cote (2002), p.10.
7 The reasons in this table are drawn from Giese and Cote (2002), Table 3, page 10.
8 For an excellent discussion on ambiguity in questionnaires, see Teas, R. Kenneth (1993), “Expectations, performance evaluation, and consumers’ perceptions of quality.” Journal of Marketing, October, Vol. 57, pp. 18-34.
9 Oliver, Richard L. (1997). “Satisfaction: A Behavioral Perspective on the Consumer.” New York: The McGraw-Hill Companies Inc., 13.
10 For the exact procedures followed in these interviews, see Giese and Cote (2002) citation, p. 4.
11 Giese and Cote (2002), p.8
12 Churchill Jr., Gilbert A. and Carol Surprenant (1982). “An investigation into the determinants of customer satisfaction.” Journal of Marketing Research. November, pp. 491-492. Available: https://scholar.google.com/scholar?hl=en&as_sdt=0%2C16&q=an+investigation+into+the+determinants+of+customer+satisfaction+churchill&btnG=
13 Churchill Jr., Gilbert A. and Carol Surprenant (1982), p. 492.
14 Bechara, Antoine, Hanna Damasio, and Antonio R. Damasio (March 2000). “Emotion, decision making and the orbitofrontal cortex.” Cerebral Cortex. Oxford, Available: https://academic.oup.com/cercor/article/10/3/295/449599
15 Jarrett, Christian (2014). “The neuroscience of decision making explained in 30 seconds.” Available: https://www.wired.com/2014/03/neuroscience-decision-making-explained-30-seconds/
16 Eagleman, David (2017). “The Brain: The Story of You.” Vintage Books, New York, p. 119-120.
17 Churchill Jr., Gilbert A. (1979) “A paradigm for developing better measures of marketing constructs.” Journal of Marketing Research. pp. 64-73.
18 Jacoby, Jacob (April 1978). “Consumer research: a state of the art review.” Journal of Marketing. 42, p. 93.
19 Giese and Cote (2002), pp. i and 10.