Editor's note: Michael Lieberman is founder and president of Multivariate Solutions, a New York statistical consulting firm.
Many research groups and start-up companies have developed tools for social media network analysis and visualization. Today, network metrics have become commonplace and functionality on layout and clustering algorithms has expanded dramatically, producing breakthroughs that have raised radically the quality of what it is possible to visualize.
The largest network graph, when Web pages link to one another, is the World Wide Web. The tens of billions of pages on the Web can each be seen as a vertex in a graph whose edges are URL hyperlinks connecting one page to another. There is no larger source of interlinked information.
Professor Robert Ackland of the Australian National University has spent a great deal of time on this topic. He writes, “These hyperlinks may point to other pages on the same Web site or to sites of other organizations, companies, institutions and nations. The result is literally a web of connections that is often mentioned but rarely seen. The network of related Web sites, although based on basic ‘Web 1.0’ technologies, represents important social, economic and institutional relationships that can reveal significant insights for researchers, policy makers and corporate strategists.”
There has been a lot of hype about Twitter, Facebook and Flickr, but Web pages remain the untapped goldmine of big data information. An entire industry, search engine marketing, has grown up around the explosion of the Internet. But who your Web site is connected to, and who connects to your Web site, is really the mother lode of network takeaways. With new technology, these links have now come online using free, open-source software and can be analyzed using Excel graphics.
Collecting and analyzing hyperlink network data allows you to answer critical questions such as: How does your organizational Web presence compare to your offline brand presence? How does your organizational Web presence compare to that of your competitors? Hyperlink data can also help you identify new competitors. If you are entering a new market, these data can give you a sense of who the current players are and how they are related. If your organization is in the area of public affairs, what other organizations are linked to it? If you run a non-profit, who links to you? In other words, where is your best fundraising source?
The VOSON Data Provider
The VOSON Data Provider is an Excel data import plug-in for the collection and analysis of hyperlink network data. It provides a front end to a data collection and processing service that is part of the Virtual Observatory for the Study of Online Networks (VOSON). This data collection and processing service consists of a Web crawler that crawls seed sites nominated by the user, extracting hyperlinks to other sites. The service also finds inbound hyperlinks to given seed sites.

One needs an account with VOSON but a free version is available for up to 10 databases. Of course, Web crawling is nothing new: Spammers have been doing it since the Web was first woven. I see VOSON as particularly useful in that it is a specialized hyperlink search service that works within the framework of Excel. The results, which are delivered in a format much like, say, Twitter links, makes it easy for non-programmers with a bit of Excel savvy to edit, shape and ultimately visualize and analyze data.
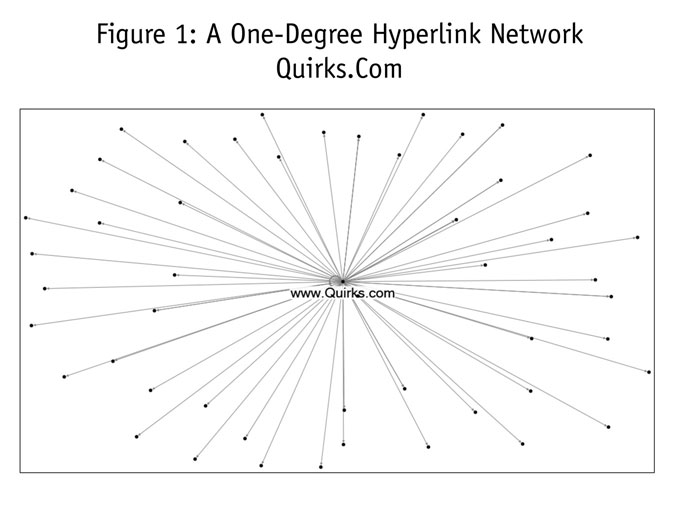
An examination of hyperlink visuals reveals that maps come in different degrees. A one-degree map – known also as an ego network – shows the result when only one seed site has been crawled. Figure 1 is an example of a one-degree hyperlink map without labels. I like to call it “the porcupine.”
A 1.5-degree map takes into account every page to which a Web site is connected and whether these pages are connected to one other. That is, for Quirks.com, we would see all the dots, plus arrows to the dots that are connected to each other.
A two-degree map collects every page to which a Web site is connected and every page to which they are connected. This is where the real deep dives lie. However, two-degree map data points expand exponentially. If a Web site is connected to 100 other sites and each of those is connected to 100 other sites, there would be 10,000 points. Most major Web sites are connected to far more than 100 Web sites or blogs.

A map of the marketing research industry
Figure 2 shows a hyperlink social map of the marketing research industry. It began with Quirks.com. However, I added about 10 other seed sites, prominent marketing research organizations (e.g., the MRA, CASRO) and some of the largest international marketing research firms (Kantar, Yougov).
The resulting database had well over 1,000 links. For reasons of space and clarity, this network is likely to suffer from an overflow of labels and may be difficult to analyze. The most common way to counteract this is to create a subnetwork consisting only of seed sites plus important links. This requires filtering the database in Excel and labeling those sites that will produce the greatest clarity for the network. This requires eyeballing and filtering the database in Excel or employing a VLookup function. However, the filtering process is not beyond the skills of any moderate Excel user.
We have done this for our marketing research hyperlink network. We then ran the network through a clustering algorithm (specifically, the Harel-Koren fast multi-scale). The resulting visualization is shown in Figure 2.
The graph discloses several points that illustrate the power of the technique. They are summarized below.
- Most major marketing research organizations are connected.
- PMRG.org, not a seed site, is connected to Kantar Health, which specializes in pharmaceutical research.
- The Web site of WPP, which owns Kantar, is connected to most of the Kantar Web sites.
- Quirk’s sits squarely in the middle of the marketing research Web space, also taking into account reporting sites such as Research Rockstar and Marketing Profs.
Case study: casual dining restaurants
Next, I tried a hyperlink network for an industry for which I do a lot of work, casual dining restaurants (CDRs). The seed sites were several of the most popular restaurants, such as the Olive Garden, the Cheesecake Factory, Buffalo Wild Wings and Applebee’s, among a few others.

In Figure 3 I have circled some of the seed sites and labeled some of the more interesting links. Several elements in the graphic come to our attention.
- There is a link between Applebee’s and the Detroit Red Wings hockey team. As it turns out, the Red Wings and Applebee’s had a co-branding effort so that Red Wings fans would enjoy a meal at Applebee’s before the hockey game.
- The Cheesecake Factory has a link to Craigslist. A new Cheesecake Factory location listed employment opportunities in Rochester, N.Y., on Craigslist.
- MoneyTalksNews.com is connected to several of the leading CDRs.
- Many university student life sites connect to CDR restaurants.
- HarryandDavid.com, the gift-box Web site, is connected to CheesecakeFactory.com.
- On The Border is connected to Groupon, indicating an effort by that chain to lure customers through the Groupon Web site.
- Darden.Com/Careers connects to the Olive Garden, which is owned by Darden restaurants.
The upshot of this heavily-filtered and -labeled graph is that the Web space of the casual dining industry connects to parent companies and to many media outlets that cover the industry. There are blogs from Urbanspoon.com, nutritional write-ups from CNN Health, etc.
Hyperlink network analysis lacks the fluidity, of, say, Twitter, and therein lies its usefulness. One can run a Web crawl for an industry space and be fairly sure that the structure will be intact for a period of a month or longer. Moreover, hyperlink crawls can be filtered to show only blogs, media and other specified outlets.
Still a vital aspect
Hyperlink networks have been around since the dawn of the Web and they are still a vital aspect of the online behavior of commercial entities, private individuals and government. Hyperlink data have been used for research into marketing and for competitive business intelligence. For example, researchers have constructed networks of telecommunication company Web sites using co-link data and show that visualization of these networks correctly maps the companies into industry sectors.
We expect the availability of tools such as VOSON to have a positive impact on hyperlink research. As mentioned above, dynamic hyperlink analysis is a fruitful area of study, as is research into approaches for jointly analyzing hyperlink and text-content data. Many companies have learned to harness the power of thought leaders, experts and influencers to promote their products and with hyperlink Web space visualizations, researchers can easily visualize and analyze these often complex interrelationships.