Editor's note: Trent D. Buskirk is vice president of statistics and methodology at Marketing Systems Group, a Horsham, Pa., research firm.
As the research and development process for optimizing surveys for smartphones, tablets and computers con-tinues there is a need to take a closer look at all of the different facets of survey-taking and survey-writing. To this end, Marketing Systems Group collaborated with researchers from MaritzCX, Research Now and FocusVision on an experiment to compare slider and radio button scales as input methods for surveys fielded on smartphones, tablets and computers. (The outcome of the experiment was published in the journal methods, data, analyses, volume 9 in 2015. To view the full published paper, citations and references please visit http://bit.ly/1WGBUIn.)
This study focused on input styles including newer touch-friendly slider bars and more standard radio buttons. In an era where touch-enabled devices are rising in popularity, knowing what respondents prefer and how they use different input styles will have a great impact on surveys designed to enhance the user experience on these devices. Results of the experiment suggest that the input style preference varies among devices and that slider bars might introduce some undesirable measurement issues compared to radio buttons.
More weaknesses than strengths
The study directly compared outcomes from respondents who completed a collection of survey scales using their smartphone, tablet or computer. Within each device, respondents were randomly assigned to complete one of 20 possible versions of scale items determined by a combination of three experimental factors including input style, length and number formatting. Results from this study suggest more weaknesses than strengths for using slider scales to collect survey data using mobile devices and also suggest that preference for these touch-centric input styles varies across devices and may not be as high as the preference for the more traditional radio button style.
Participants for this study were recruited from Research Now’s U.S. consumer e-Rewards panel, which consists of nearly 2.5 million adults, making it one of the largest sources of online responses in the U.S. The overall survey consisted of up to 60 possible questions about automobile insurance satisfaction and was designed to be completed in no more than 10 minutes using a Web browser. The survey was optimized for mobile devices and was fielded in the U.S. between April 4 and 11, 2014 and each respondent received an e-incentive that was comparable in value to other panel surveys of similar length.
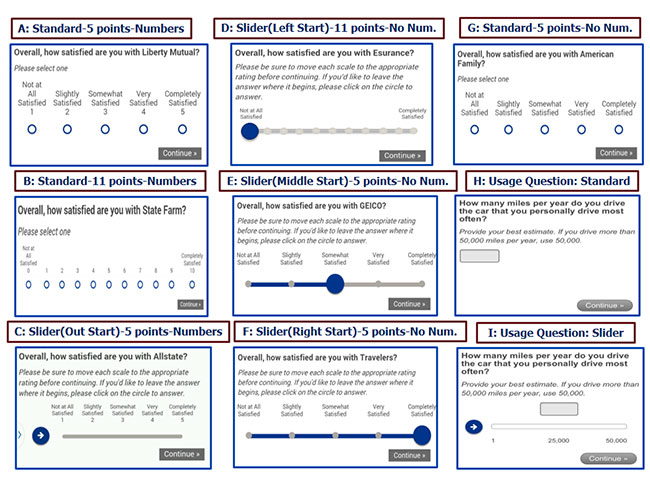
Due to limitations with device availability across all panelists, device type was not randomized but served as a natural blocking variable. All experimental randomizations were thus made within each type of device separately and independently. After clicking [Start] on the introduction page, each panel respondent was then randomized to receive scale items for the experiment that were formatted according to one of five possible scale types including: standard radio buttons or sliders with either an outside, left, middle or right starting position (as illustrated in Figure 1: A, C-F).

We provided an additional instruction for respondents in any slider scale group to click on the slider handle if their answer was consistent with where the slider began (see Figure 1: C-F). Because this experiment was conducted within the scope of a market research study that required standard radio button scales to produce estimates, the randomization to the scale type used a 4:1 ratio within each type of device with four respondents being randomly assigned to standard radio buttons for every one randomly-assigned to each type of slider scale. In addition to scale type, respondents were equally randomized to one of two scale lengths (five-point vs. 11-point) and equally randomized to one of two scale numbering formats (numbered versus not numbered). All five-point scales were fully anchored with semantic labels and the numbered versions also included number values below each of the semantic labels (see Figure 1: E,G and A,C, respectively).
In this article we focus on 22 “core survey items” organized into three broad categories with questions pertaining to 1) overall satisfaction with current automobile insurance provider; 2) overall automobile insurance brand performance (e.g., trust, discounts, customer service, convenience, value and accessibility) and 3) preferences for automobile insurance service (e.g., automobile insurance purchase and agent interactions, mobile transactions with insurance company, etc.). These core survey items were presented to participants over seven separate screens. The actual values assigned to responses for five-point scale items ranged from 1 to 5 and from 0 to 10 for 11-point scale items.
A total of 1,201 computer, 1,199 tablet and 1,198 smartphone respondents completed the experiment. Completion times for the collection of 22 core scale items (on the natural log scale) varied significantly by both the device used for completing the survey (F(2, 3169)=27.27; p-value<.0001) and by the scale type (F(4, 3169)=3.85; p-value=.0040) and these effects were additive in that no interaction between these two factors was detected. Specifically, the geometric mean completion time for PC respondents was estimated to be about 19 percent longer than that of smartphone respondents (p-value <.0001) and estimated to be about 23 percent longer than that of tablet respondents (p-value<.0001). No significant differences were found in completion times for the core scale items between smartphone and tablet respondents (p-value>.01). Respondents assigned to the slider left-start and slider outside-start groups had the longest estimated geometric mean completion times (about 135 and 133 seconds, on average, respectively) and the geometric mean completion time for the slider left-start group was estimated to be about 11 percent longer than that for the slider right-start group (p-value=.0024). No other significant differences in completion times were found between any of the other scale types.
In the opposite direction
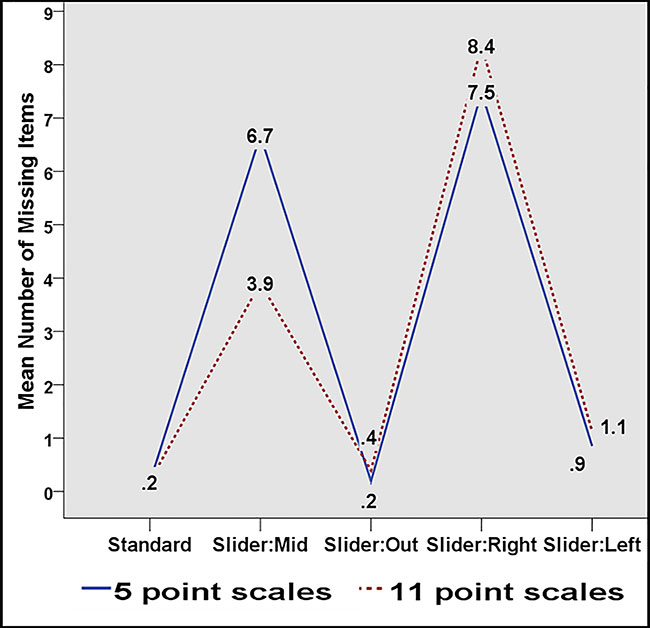
Our results for survey completion times among the slider with a left-start group echo the findings from prior research in direction but the differences we observed were not statistically significant. However, our findings for the other slider start positions, including most notably sliders with a right or middle starting position, were in the opposite direction in that we found completion times for respondents in these two groups to be shorter than those for the standard scales, albeit not statistically significantly different. This opposing result could be directly related to the fact that we observed higher missing items from respondents from both the middle- and right-starting slider scale groups as shown in Figure 2. In some cases, respondents in the right-slider start group who were highly satisfied with their insurance provider might have taken much less time to answer the satisfaction questions simply because their responses corresponded to the slider starting position. As such, respondents may not have taken the time to click on each item but instead hit the next button for the survey to continue, re-sulting in missing data.
As Funke et al. (2011) note, “if the handle is placed at the position of a valid answer, intentional response and non-response cannot be distinguished.” One starting position that would avoid this issue is outside or off of the slider itself. However, this choice requires more space for the overall slider graphic. While making the slider handle smaller to create more room for the actual slider bar itself might work for mouse interfaces, it might be less optimal for interfaces that rely on finger taps. In our study we also found that respondents completing scale items using an outside starting slider were the least likely to prefer slider scales compared to any other starting position.
Another option to remedy the missing-item issue might require respondents to move the slider away from its starting position and then back to the response category to register the response. Such a requirement would, however, increase the number of taps required to complete the question from one to two for the slider scales compared to what is required for the radio button scale (Buskirk, 2015b). Such an approach was used by Sellers (2013), who compared slider bars scales with middle, left and right starts to radio buttons. They found that with a forced-choice requirement, respondents in the right slider group reported higher right-choice options and respondents in the left-choice group reported more lower-choice options compared to respondents in other groups. Contrary to the method employed by Sellers, we did not force respondents to confirm answer choices for which the slider was neither moved nor clicked and we observed that respondents in the middle- and right-slider start groups tended to select these answer categories significantly less often than any other scale group, as shown in Figure 3. The presence of missing items among the middle- and right-slider starting positions translated into overall scale measures that were consistently and significantly lower, on average, compared to the same measures reported from the other slider starting position or radio button groups – in some cases as much as 35 percent less.
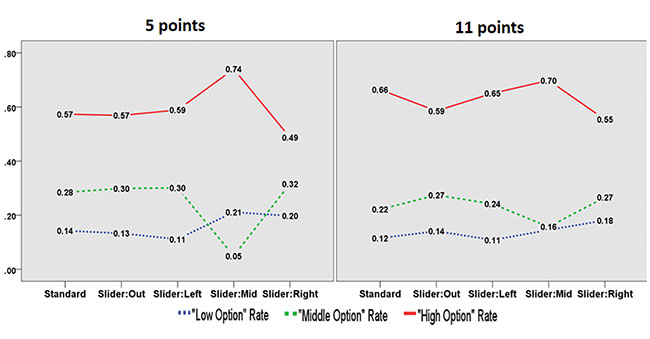
Respondents in the right-start slider scale group who registered answers for scale items moved the slider away from the starting position but ultimately did not move it back. This pattern was generally consistent across the three devices and both scale lengths; however, the pattern was much stronger with the shorter version of the scale as shown in the left pane of Figure 3. More specifically, the high option selection rates for those assigned to five-point scales (defined as selecting a 4 or 5 on the 1-5 scale) with middle slider scales were 25 percent higher than those from any other scale group. Respondents seeing five-point scale items in the right slider group selected higher categories at rates that were between 8 to 50 percent less than those of any of the other scale groups.
We also found that respondents in the middle slider start group also chose lower-end options (i.e., 1 or 2 on the five-point scale; 0, 1, 2 or 3 on the 11-point scale) more often than any other scale type except the right-slider start group. This finding replicates the pattern observed by Petersen et al. (2013), who reported higher amounts of 2s and 4s being selected on a five-point slider scale that had a middle start compared to other non-slider presentations.
The similarity in the percentage of respondents in the left-starting slider and radio button groups choosing higher options for the core scale items echoes what Cape (2009) found in a study comparing left-starting sliders with different labelling options to more traditional radio buttons. Specifically, Cape (2009) found that while distributional differences were noted for survey outcomes across different scale types, the “box top” or percentage agreeing with a statement were nearly identical across the scale types. However, in our study we also saw contrasting results between the radio button group and both the middle-slider group, where respondents had significantly higher “box top” rates, and the right-slider group, where respondents exhibited significantly lower “box top” rates.
In addition to differences in completion times, missing items, response options and survey outcome measures, we also found differences in preferences for the slider scales. Such differences in preference rates by scale input style might reflect more of a conditioning effect in that respondents may likely prefer what they are comfortable with rather than something new. We expected that some respondents with a radio button survey input style would, for example, express higher preferences for radio buttons when faced with a choice between those and a new slider version and, conversely, for slider input styles.
Indeed, others have found somewhat similar results in experiments that simply asked satisfaction with sliders/radio buttons at the end of the survey experience without requiring respondents to choose between alternate methods of input. In our study we certainly saw evidence of a conditioning effect for preference as well in that those who were presented slider-bar questions in the main experiment and then asked to complete an item using radio buttons generally expressed interest in sliders. However, they did not express this interest as consistently as those who completed standard scales in the experiment and then completed one additional slider item did for standard radio buttons (76 percent of respondents in the radio button version expressed interest for radio buttons compared to 63 percent of respondents in a slider group who expressed interest for sliders).
We also found that generally, the preference for sliders increased from PC to tablet to smartphone respondents but the degree of differences across devices was still influenced by the input style to which respondents were assigned. More work is needed to better understand whether preferences for sliders might be higher among PC respondents who have touchscreen monitors compared to mouse-only input.
Come at a cost
While sliders may offer more engagement for respondents they come at a cost when thinking about implementing them across many device types with differing space and hardware constraints. And, no matter how engaging sliders can be compared to radio buttons, missing items still persist and can certainly be a function of starting position as well as the underlying distribution being estimated. Preference for sliders tends to skew towards those using mobile devices to complete surveys but this preference doesn’t overwhelm previous experience with radio buttons.
Even though sliders might be more preferred by smartphone respondents, they also add to the completion times, overall. And, given that many studies have consistently shown that surveys tend to take longer on smartphones compared to PCs (Buskirk, 2015b, Wells et al., 2014), it’s hard to know whether the positive impact sliders have on engagement would outweigh or be nullified by the negative impact of longer surveys. More work is needed to understand just how slick a slider needs to be to hit this sweet spot.