
Let’s get tracking
Editor's note: Elliot Savitzky is senior vice president at TRC Market Research. He can be reached at esavitzky@trcmarketresearch.com.
In Part 1 of this article last issue, we looked at the reasons for conducting tracking research and the types commonly used. This time around, in Parts 2 and 3 we will cover key metrics, how to control variables, how to analyze data and, of greatest importance, how to effectively report the findings of any analysis.
In the past, telephone survey research was the prevalent method of conducting any tracking study. As cell phones became ubiquitous, respondents were no longer willing to engage in 50-minute surveys. Call screening, homes with no landlines and the arrival of caller ID further restricted response levels from individuals that were primarily targeted during and after dinner time.
Conducting surveys online became more efficient and led to better representation of targeted markets. What didn’t change, for a long time, was the assumption that you could simply apply the same techniques that were used on telephone surveys to online surveys. Surveys remained too long, rating scales were not updated to reflect the online experience, items within rating questions stayed way too wordy and the way we collected and analyzed open-end textual data did not change.
As a result, practices that had been used during the days of telephone interviewing became even more prevalent with online surveys. Respondents were not qualified to take part in the specific survey, they sped through the survey, they straightlined their answers and did some research of their own before answering open-ended questions in order to fit the screening criteria.
There are only a finite number of potential respondents that are empaneled by sample providers, all providing incentives to complete surveys. The problem was exacerbated when the market research industry realized that many of the same respondents were being used repeatedly by all the different sample providers. Sample companies and research agencies have been working hard to reduce fraud by placing tests within the analyses of survey-generated data to identify and eliminate cheaters and to reduce the number of multiple respondents that originate from the same IP addresses. While cooperation rates continue declining, the quality of the data obtained has increased. Unfortunately, with fewer quality samples available, particularly for B2B research, costs per respondent have increased.
So the current line of thinking mandates a number of dramatic changes to the surveys themselves, including:
• limiting survey duration to no more than 20 minutes if possible;
• trimming attribute lists to no more than 12;
• reducing the number of brands rated at any one time;
• making survey mobile-ready (limit the number of attributes per screen; shorten rating scales; fit the screen to the device);
• eliminate redundancy (no reason to ask stated importance if it can be derived);
• reduce the number of dependent variables (overall satisfaction, likelihood to recommend, consideration, share of wallet, constant sum, etc. – pick one!);
• eliminate irrelevant questions;
• eliminate questions you already know the answers to;
• avoid “questionnaire by committee” syndrome.
Base design on the objectives
What are the key metrics for an effective tracking study? You can’t design any questionnaire unless you base its design on the objectives of the research. For an advertising tracking study, you need to go back to the strategy that was created for the development of new advertising (the copy strategy) as well as the marketing and media plans. What is the copy trying to accomplish? Is it directed at new users or prospects or is it designed to reassure your loyal user base? Think hard about what you are trying to accomplish and design the survey accordingly. Figure 1 shows a way to conceptualize the types of questions you would want to include in the survey as you view the marketing funnel overall.
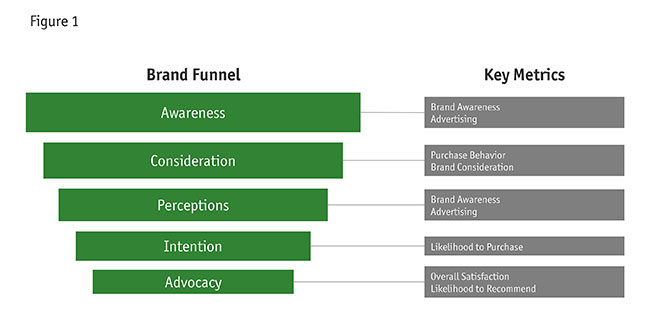
That said, there is a standard set of questions that should be included in any tracking study and asked of everyone who passes the screening criteria. These questions should relate to the following:
• brand or advertising awareness
• familiarity (knowing the brand name alone is not enough to know the brand)
• brand experience – current portfolio of products used or purchased in the past (e.g., currently, most often, past year, past three months)
• consideration – what brands are in contention for selection?
• brand ratings – limit the scale, limit the number of brands rated and limit the number of factors they are rated on (respondents should be aware of and familiar with the brands that are being rated)
• loyalty metric – e.g., satisfaction, likelihood to recommend, share of wallet
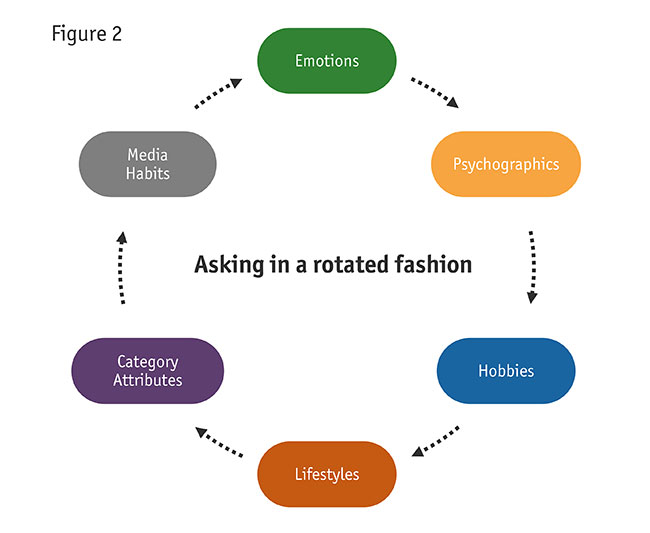
All other question areas, except for the demographic profiling section, can be covered in a rotated fashion so that not everyone is asked every question. This will help to limit the length of each questionnaire. The answers to these question areas are typically lower priority and a smaller sample for analysis is often adequate. As an example (Figure 2), one-third of the sample could be asked two of these modules each, so that all modules are asked among the same number of respondents: emotional assessment; category attitudes; lifestyles; psychographics; hobbies; media habits. So, one-third emotions and psychographics, one-third hobbies and lifestyles and one-third category attitudes and media habits, etc.
Constructing a tracking study
When constructing a tracking study, the first step is deciding where you are going to source your sample of those potentially in your target market. Although some panel companies screen their panelists for preexisting or former brand usage or certain characteristics or behaviors, this almost never aligns with what you’re trying to accomplish. And even if there are pre-screened panelists, there is no guarantee the data is current.
It’s important to work with a trusted panel partner who can not only complete the initial project but also be available for future ones. This avoids the introduction of an unwanted variable.
Samples of tracking studies are usually stratified using a few key characteristics that are relevant for the market(s) being investigated:
• Region – Is it national or regional or specific test and control markets?
• Age – Do we need to survey everyone 18+ in age or are there defined targets like Gen Z and/or Millennials which will require stricter definitions?
• Gender – Male and/or female? 50/50 split or skewed in any fashion? Remember that today’s gender roles are not as rigidly defined as male or female now that non-binary is an option.
• Income – For many categories, household income is a key criterion for a potential market target which may require a more affluent sample.
Once completed, these strata are often weighted to how they are represented in the larger universe and often balanced to previous waves of tracking to be “more representative” and to minimize bias between waves.
As an example, when you design a tracking program, you might specify that out of a sample of 1,000 completed interviews, you will require the sample to contain males and females, aged 18-54 and to have household incomes above $50,000.
In order to manage the number of completed interviews and to maintain a representative sample, you are likely to require that the interviews have quotas enforced such that:
• Half are among males and half among females.
• The age groups are divided such that there are equal numbers of completed interviews in each of the following subgroups: 18-24; 25-34; 35-44; 45-54.
• Similarly, household income might be divided into the following groups: $50,000-$59,000; $60,000-$69,000; $70,000-$79,000; $80,000-$89,000; $90,000-$99,000; $100,000+
• Geography is usually divided by time zone or the four Census regions and the nine divisions within them.
The point in going through this level of rigor is to make sure you can compare your sampled population to the known Census data and to weight your sample back to those known data points to ensure representation of the U.S. population that are between the ages of 18 and 54. As each of these points of stratification are taken into account, the weighting scheme becomes more complex as they are all interrelated.
So if you were to conduct a tracking study among people aged 18-54, you can be certain that whatever data you collect can be projected onto the larger population, e.g., among adults up to 54 years of age, 23% of the population in the U.S. are aware of the Acme brand of car polish.
Timing is key
One of the most important variables you need to control is timing of the research. Of course, if you are conducting a continuous study, then consistency is the only concern.
If research is being used to trend from previous waves, it is critical to replicate the timing of the previous reading if possible. If the post-wave was conducted as soon as the media spending stopped then you need to continue with that trend. Again, this is not really an issue for continuous tracking but important for point-in-time tracking programs.
If this is not a continuous tracking program, you need to decide how long you intend the post wave to continue. Usually, you want to allow for a lead-lag effect to take place, which means you don’t want to complete the cycle of interviewing too soon. However, how long you want it to continue can be difficult to assess, which highlights an additional benefit of continuous tracking.
Skew the outcome
Changes to any tracking study can skew the outcome, making it ineffective to compare results to those of previous waves. Whenever we see major changes in the trend of data from a tracking study that has been either been changed in its design or taken over from another company, the immediate questions are: What changed? Did the market register a change or did the results change because the study changed?
Potentially variable factors can include any or all of the following: the company managing the research; the method of execution; the sample source; changing the sample; changing the sampling geography; changes to the study’s timing; changes in survey flow or the addition/deletion of key question areas; changes to sample composition; programming errors; data tabulation errors; changing the brands being assessed; changing key characteristics of an attribute list; changing key evaluative criteria and/or rating scales.
Assuming you want to maintain historical trends where possible, the following is the approach we would take to minimize the variables that could potentially impact those trends:
• Utilize the same sample source/panel provider.
• Maintain as much consistency between the previous survey as possible, particularly the key metrics and the order in which they were obtained.
• Maintain sampling geography.
• Keep the sample composition consistent.
• Maintain survey frequency wherever possible.
All or even most of the above list may not be totally possible to achieve. However, you can maintain consistency by conducting a bridge wave, which is a method of comparing the impact of variables by conducting a tracking study while simultaneously using two different survey vehicles and then comparing the results. Comparing historical trends between the two versions can help determine how any of the variables that changed may have impacted any trends. By understanding the correlation between the two versions and the historical trends, you can develop models for calibrating the data going forward.
Dependent on the objectives
The processes of analyzing marketing-related data and reporting any insights are intertwined with the design of the research and the creation of the survey, all of which are highly dependent on the objectives of the research. What are you trying to accomplish by conducting a tracking program? To measure the effectiveness of the ad campaign after launch or is it more to assess brand health and to identify threats and opportunities? Maybe it is to read the impact of a heavy-up spending plan?
None of the work that needs to be done can be divorced from tying everything back to the objectives. How you organize the data into logical time frames for evaluation and how you weight the sample and balance it to previous waves of data is all contingent on the objectives of the program.
How do you start the process? Go back to the objectives of the research. Let’s assume you are conducting a continuous tracking program to assess in-market ad effectiveness. What does “ad effectiveness” actually mean? Assuming there was appropriate pre-testing conducted on the advertising executions that successfully achieved its objectives based on the copy strategy, you would be hoping to support learning that would suggest that your in-market advertising was both memorable and persuasive.
And what about the media plan? Is the ad budget sufficient to break through the clutter of competitive activity to make sure your message is even heard? How do you know it is enough? Have you compared the media plan to competitors’ spending? One of the problems we typically run into is that competitive spending data isn’t available. Further, there is no guarantee that the media spending plan that your ad agency creates will actually be executed as intended. It can take months to obtain in-market spending levels, so you are essentially assuming that the media plan was met and holding your breath that you have spent enough to break through the clutter of competitive spending.
How much do you need to spend to be heard and how much spending is enough before you start to see signs of ad wearout? Wearout is a relative term. One version defines it as the point where the mix of creative, media placement and spending stops achieving a campaign’s communications objectives and generating a response or consumer interest. The first exposure to a commercial/ad is the most effective. Repeated exposures ultimately lead to diminishing returns. Advertisers need to understand how exposure frequency influences consumer behavior.
In previous work we conducted in the early 2000s we often referred to internal research that found you needed to spend somewhere in the area of 700-1,000 targeted rating points in order for a single ad to run its course before it needed to be replaced with a pool-out.
Think about the time frame for analysis in combination with the time frame of your tracking. Unless you are conducting a continuous tracking program, you may not be in a position to organize your results by a time frame that is consistent with your media plan to be able to see the impact of any potential wearout until it is too late.
This is also why you need to overlay the spending levels along with your trended data so you can observe the relationship between the pattern of spending and its impact on key metrics like awareness, persuasion and imagery. Brand perceptions or imagery, however, do take longer to deteriorate as they tend to follow a lead-lag pattern of decay.
All of this trended data can help you to build forecasting models so that you can predict, within a certain level of certainty, how spending levels are likely to impact key metrics like awareness. And, if you can obtain in-market performance from the client, you can validate your tracking metrics as indicators of market performance. Imagine the scenario where you can link pretesting metrics, survey tracking data, digital tracking data, spending levels and in-market trial, repeat and share to create a holistic view of pre-market, in-market and post-advertising spending market performance.
The above scenario is uncommon, so a typical analysis is a key driver analysis where dependent variables like brand ratings are correlated with any number of dependent variables like satisfaction, most-often usage, repeat, recommend, etc. Identifying which of the many brand attributes are driving positive attitudes and hopefully behaviors can help refine the copy strategy going forward.
Other analyses that prove helpful are perceptual maps that visually display the relationship between brands and the images that define them. Overlaying the key driver analysis can identify important areas that are either not being delivered on or are weaknesses for your brand.
Overall, the key to an impactful report is to think about it as telling a story rather than reporting the facts. There are few things in research that are more ineffective than a 100-page tracking report that lists all the data in excruciating detail.
Rather, go back to the objectives and determine what is important to report and what is secondary. Create the “red thread” that weaves its way through the report, telling the story of what the team needs to know about its brand and the market in which it competes.
Learn further
There are so many areas to consider when planning, executing, analyzing and reporting a tracking study. While we have covered several of them here, we invite you to challenge us with your needs for implementing a program and learn further with us how to make the process more effective.