Editor's note: Michael S. Garver is professor of marketing at Central Michigan University, Mt. Pleasant, Mich. Richard Divine is professor of marketing at Central Michigan University. Dominic Nieto is a student at Michigan State University.
Leading organizations use customer experience (CX) research to obtain marketplace feedback to drive strategic and tactical decisions. At the heart of this strategy, researchers and executives want to know how to improve the customer experience. While CX research is a powerful management tool, research suggests that the majority of CX programs need significant improvement (Allenson 2016). Most CX research improvements put forth by authors either focus on how to better use CX data to drive improvements or on improved research methods to collect and analyze data. This article will examine new CX research analysis tools for conducting key driver analysis.
Key driver analysis is a common procedure for statistically inferring the importance of CX attributes (independent variables) that drive the customer experience(dependent variable). Yet there are critical assumptions and limitations of key driver analysis that are frequently ignored. Two of these limitations are ignoring the existence of different key driver segments in the customer base and multicollinearity associated with independent variables or CX attributes. Academic researchers have developed new statistical modeling techniques to overcome both of these limitations. For example, latent class regression (LCR) has been employed to identify key driver segments in the customer base while correlated components regression (CCR) has been developed to overcome problems associated with multicollinearity. The purpose of this article is to put forth a process for using both LCR and CCR to conduct key driver analysis with CX data.
In a key driver analysis, CX attributes are given importance scores that inform management about which CX attributes have the most impact on driving the customer experience. In addition, CX attribute importance scores also drive the prioritization of improvement opportunities. CX researchers often use quadrant analysis to prioritize improvement opportunities. Quadrant analysis simultaneously examines CX attribute importance and performance scores to determine which CX attributes should be prioritized for improvement opportunities. If CX researchers report biased attribute importance scores, then biased improvement opportunities will likely be the result. Implementing LCR and CCR for key driver analysis will result in more accurate, valid and reliable CX attribute importance scores.
Basic principles of LCR and CCR will now be put forth followed by a research approach that employs these statistical techniques in a complementary manner.
Latent class regression
Path modeling techniques (i.e., multiple regression, structural equation modeling) assume that one model (i.e., one key driver analysis) is appropriate for the entire population of customers. The assumption suggests that all customers have the same needs and use the same evaluative process, yet this is usually false. Practitioners should expect that customers are different and will have varying needs and preferences. If CX researchers believe that customers have different needs, then they should use statistical techniques designed to uncover and identify different key driver segments.
Latent class regression has received much research attention over the last decade because it does NOT assume that one statistical model (i.e., key driver analysis) is appropriate for the population. Path modeling techniques calculate the single model or equation that best fits all of the data and in that process any differences between groups of customers get smoothed out.
LCR analysis is conceptually similar to multiple regression in that independent variables are used to predict a dependent variable. However, LCR creates a unique key driver analysis for each customer and then aggregates those customers who produce similar results. The number of homogeneous segments identified is determined by the data, rather than by dictating a one-size-must-fit-all solution. While LCR is predicated on the idea that many segments are mixed together in unknown proportions within the population, if the data indicates there is only one viable underlying segment, then LCR will produce results comparable to traditional CX analysis. The advantage of LCR is that it has the capability to identify different segments in the population and produce a customized regression equation (key driver analysis) for each segment.
Correlated components regression
Path modeling techniques have long been used to examine key driver importance scores for CX attributes. An important assumption and limitation with path modeling analysis is multicollinearity, which is essentially high correlation among the independent variables employed to predict a dependent variable. As a result of multicollinearity, it is common that the standardized beta coefficients from path modeling techniques can be heavily skewed, biased and simply wrong. Multicollinearity is a serious problem that can adversely affect the results of key driver analysis, causing decision makers to overprioritize some drivers and ignore the impact of others.
A number of new statistical techniques have been developed to combat issues associated with multicollinearity. One relatively new statistical technique is called correlated components regression. As a result of using correlated components regression, research has demonstrated that the results will be more reliable, valid and accurate with holdout samples (Tenenhaus and Magidson, 2011). More specifically, correlated components regression delivers more reliable, valid and accurate standardized beta coefficients with the correct sign, size and significance level, allowing CX researchers to more accurately deliver CX attribute importance scores even in the presence of multicollinearity. In addition, because CCR results are guided and driven by cross-validation results, CCR significantly improves predictive performance with holdout samples, thus improving model performance in the population.
Overcome different assumptions
In the spirit of research triangulation, LCR and CCR are complementary statistical techniques that individually overcome different assumptions and limitations of path modeling techniques. We feel that these two techniques should be used together, yet there is little published research on exactly how to achieve this objective.
The purpose of this article is to fill this gap by proposing and demonstrating a process that employs LCR and CCR together to conduct key driver analysis. In this process LCR is used to let the data determine what the appropriate number of segments is, who belongs to which segment and what the appropriate key driver analysis is for each segment. However LCR alone does not guarantee that those customized equations for each segment will not be biased by the effects of multicollinearity. Thus LCR should then be followed up by using CCR to recalculate the equations for each segment in order to account for multicollinearity and thus improve the predictive performance of the key driver analysis within each segment.
The research process undertaken in this research study started with LCR so that CX researchers could identify the number of key driver segments along with segment membership of their customers to each segment. Once the number of segments and segment membership was identified with LCR, then CCR was implemented to refine the regression model (key driver analysis) for each LCR segment.
To empirically demonstrate this new research approach, a Web-based CX survey was created for end users of a software program. The Net Promoter Score (NPS) question was implemented as the dependent variable. CX performance attributes were measured on a 1-to-10 scale, with 1 meaning “poor” and 10 meaning “excellent.” To develop a list of CX attributes, interviews and focus groups were conducted with end users. The resulting list of attributes was shown to another group of end users, whose feedback was used to refine the wording for the following CX attributes: quality product and solutions; new software releases; overall value; training; understands your needs and requirements; performing like a trusted partner; saves you time and effort.
In the final sample, 1,500 respondents were invited by e-mail, with a password-protected link to take the survey. From this activity, 1,269 e-mails were successfully delivered, with 402 respondents completing the survey. After rigorously cleaning the data, 357 respondents with complete and quality answers remained in the sample, for a response rate of 28 percent.
Results
LCR analysis
Latent Gold 5.1 was the latent class regression software used to analyze the data. The researchers used the random seed default in the program, which means that 10 different starting points were randomly selected for each analysis, which is considered a best practice. From a practical standpoint, the sponsoring company thought that they could only respond effectively to at most three key driver segments. With this in mind, one-, two- and three-key driver segments were specified and evaluated in the LCR analysis.
LCR model evaluation and selection
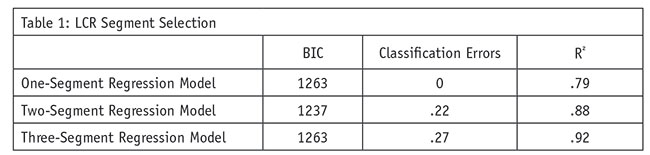
The first step in LCR analysis is to identify the number of key driver segments in the data. To make this decision, the researchers relied heavily upon the BIC goodness of fit index. The BIC index accounts for parsimony, while simultaneously explaining model fit, with a lower BIC value showing strong evidence for a better fit. In addition to BIC goodness of fit index, the researchers also examined misclassification errors as well as R2 values, along with researcher judgment. The researcher first specified and estimated a one-, two- and three-segment model.

Model evaluation and selection results are included in Table 1. The BIC index clearly suggests that a two-segment model is most appropriate, having a smaller value than both the one-segment and three-segment models. As the number of segments increase, so too will the misclassification errors. Thus, it is important to note the relative differences in misclassification errors. There is a large increase in misclassification errors as the model progress from a one-segment model to a two-segment model, with misclassification errors increasing from 0 to .22, and to .27 as compared to the three-segment model. As the number of segments increase, R2 values will generally increase as well. For this reason, it is important to note the relative differences in R2 values. Examining R2 values, there is a relatively large increase in the variance of the dependent variable as explained by the independent variables when comparing a one-segment model (.78) to either a two-segment model (.88) with a much smaller increase for the three-segment model (.92). There is a .10 increase in R2 value comparing a one-segment and two-segment model, yet there is a .04 increase in R2 values comparing a two-segment to a three-segment model. Examining R2 values lends strong statistical support for a two-segment model. After examining the criteria to evaluate the appropriate number of segments, and gaining practitioner insight into the results, the researchers selected the two-segment model.
CCR analysis
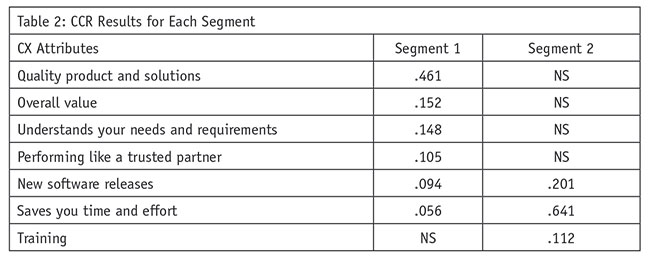
LCR analysis provided segment membership for each customer in the sample. With this information, the researchers then used CCR to refine the regression models (key driver analysis) for each segment. CCR analysis was run for each of the LCR segments, resulting in two separate CCR models. For each CCR model, all CX attributes were entered into the analysis. CCR analysis was run employing the appropriate amount of regularization to combat multicollinearity among these independent variables. Stepwise analysis was implemented to identify statistically significant relationships between the independent variables and the NPS. Stepwise analysis in CCR analysis is guided by cross-validation R2 values and NOT the training data, a noted research limitation with traditional stepwise regression analysis. The refined regression equations from CCR for each LCR segment will now be discussed (see Table 2).
Key driver segment one – the “quality and value” segment
Segment one, the “quality and value” segment, represents 78 percent of the sample, making this a very large segment, representing the majority of the customers. CCR analysis of segment one resulted in implementing three components for the regularization process, suggesting relatively high levels of multicollinearity among the independent variables. The stepwise analysis process resulted in six statistically significant predictors and a very high R2 value, suggesting that a very high level of variance in the dependent variable is explained by the predictor variables. The R2 value for this key driver segment was .92 in the training data and .91 in the cross-validation data.
The regression model for this segment has six statistically significant predictors, with “quality products and solutions” having the largest beta coefficient (.461). One tier down, “overall value” (.152) and “understands your needs” (.148) have relatively large beta coefficients but much smaller than “quality products and solutions.” “Performing like a trusted partner” (.105) and “new software releases” (.094) have smaller beta coefficients, while “saves you time and effort” (.056) has the smallest beta coefficient. “Training” is not a significant predictor for this segment.
The “quality and value” segment is driven most by quality, value and understanding needs but is also driven by the majority of CX attributes, suggesting that six CX attributes play a significant role in influencing the customer experience.
Key driver segment two – the “saves me time” segment
Segment two, the “saves me time” segment, represents 22 percent of the sample, being a relatively small segment in the study. The CCR analysis of segment two also resulted in implementing three components for the regularization process, suggesting relatively high levels of multicollinearity among the independent variables. The stepwise analysis process resulted in only three statistically significant predictors and a R2 value of .71 in the training data and .67 in the cross-validation data. The R2 values suggest a high level of variance of the dependent variable is explained by the predictor variables but a smaller amount relative to segment one.
The “saves me time” segment has three significant predictor variables. “Saves me time and effort” has the largest beta coefficient (.641), while “new software releases” has the second largest beta coefficient (.201), followed by “training” (.113). This segment is so-named because “saves me time” has the strongest influence on the customer experience.
Different in many ways
The key driver segments are different in many ways. Segment one is driven by six CX attributes, while segment two is driven by only three CX attributes. More importantly, the key driver importance scores are significantly different for each segment. For example, segment one is primarily driven by “quality products and solutions,” “overall value” and “understands my needs,” whereas these attributes are not even significant key drivers for segment two.
In contrast, segment two is primarily driven by “saves me time and effort” whereas this attribute has the smallest key driver importance score for segment one. Likewise, “training” is a significant key driver for segment two yet is not a significant key driver for segment one. “New software releases” is a significant key driver for both segments yet has a significantly higher importance score for segment two.
Now that each key driver segment has been identified and defined, the researchers wanted to examine CX attribute performance for these segments. Do the key driver segments have significantly different levels of performance?
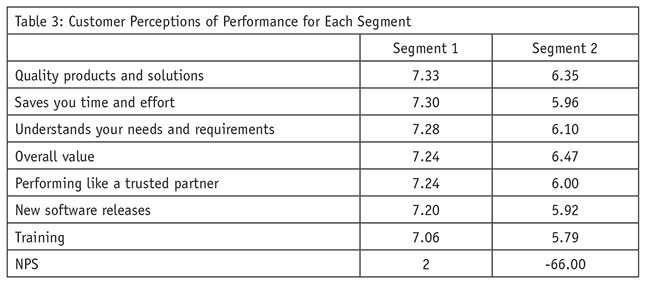
Performance scores for the CX attributes are relatively close in value for segment one (see Table 3), ranging from 7.06 to 7.33. The top three CX attributes in importance are also at the top of the list in performance scores, representing three of the top four CX attributes. Generally speaking, CX attributes with the highest importance also have the highest performance.
Performance scores for segment two are very different from those scores reported for segment one. When examining performance levels for segment two, performance scores for the CX attributes are significantly lower, ranging from 5.79 to 6.35. The top three CX attributes in importance (saves me time and effort, new software releases and training) also have the lowest performance scores. Clearly, these three CX attributes would be prioritized for improvement opportunities.
When comparing performance levels for the two segments, the two segments have significantly different levels of performance for all the CX attributes and NPS (t-test p values are all well below .05). Both segments have low performance scores, which is typical of this software product line. However, segment two is significantly more dissatisfied. For example, the average performance score across all CX attributes is 7.24 for segment one as compared to 6.09 for segment two. Furthermore, the NPS score for segment one is 2, whereas the NPS score for segment two is -66.
Interesting and insightful
Employing LCR and CCR resulted in two key driver segments with significantly differently CX attribute importance scores as well as significantly different performance scores. While the rest of the analysis is beyond the scope of this article, the resulting story is interesting and insightful. The sponsoring organization targeted segment two, the “saves me time” segment, for improvement opportunities while a maintenance strategy was implemented for segment one, the “quality and value” segment. Why?
Segment two customers had a significantly higher likelihood of being “A” customers who were also more leading-edge in their software needs. Qualitative research confirmed the key driver analysis as well as yielding more insights into this segment. In short, segment two was very dissatisfied because the software did not meet their new and still-emerging needs. Thus, segment two customers had to spend a great deal of time and effort trying to make the software meet their needs through a variety of workarounds. This segment needed new software releases and features that would save them time and effort by meeting their needs. In addition, they needed training to help them with short-term workarounds but also to help them better utilize existing and future capabilities of the software.
If standard key driver analysis was employed with this data, insight into this emerging segment of customers would have been lost and a different improvement strategy would have been implemented. Instead of an improvement strategy tailored for a specific group of important customers with specific key driver requirements, the improvement strategy would have been one-size-fits-all, without fitting anyone.
References
Allenson, Michael (2016), “Why maturity matters for customer experience management,” Quirk’s Marketing Research Review, article ID: 20161011.
Tenenhaus, M., and Magidson J. (2011), “Correlated component regression: A sparse alternative to PLS regression.” 5th ESSEC-SUPELEC Statistical Workshop on PLS (Partial Least Squares) Developments.