Let’s translate your data into visual stories.
Researchers uncover remarkable insights but translating dense data into clear, compelling visuals can be a challenge. We help research teams turn their unique findings into visual stories that resonate with any audience, from executives to consumers. Send us your reports and we will visualize your insights with custom-crafted designs and infographics.
Led by Lisa Vissichelli, an award-winning data visualization expert with over a decade working alongside leading research agencies, our capabilities include:
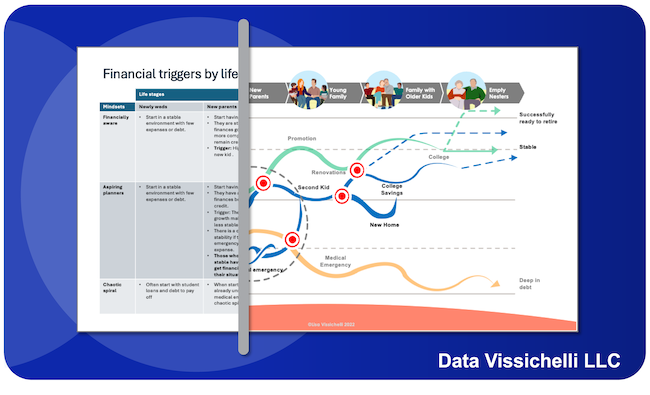
Visual storytelling
Infographics, executive summaries, journey and experience maps and personas that distill insights and illustrate user behaviors with empathy.
Strategic reports and presentations
Branded reports, syndicated decks, leadership and event presentations designed to engage and inform.
Custom data visualizations
Whether utilizing quantitative, qualitative or behavioral data, our custom-crafted visuals are recognized by Adobe, Information is Beautiful Awards and the Data Visualization Society.
Visit datavissichelli.com to learn more.
![]()