
The uncomfortable truth about fraud detection in market research
Editor’s note: Mary Draper joined the EMI Research Solutions team in 2014 as a senior research manager. Today, as vice president, strategic accounts and quality, she ensures the health and integrity of the data EMI provides its clients, offering expertise on online sample, project management and quality best practices. Find Draper on LinkedIn. As the digital marketing director for EMI Research Solutions, Brian Peterson brings over 15 years of B2B marketing experience and an advanced knowledge of industry and market trends. He is a 2023 Greenbook Future's List winner, and host of the Intellicast podcast. Find Peterson on LinkedIn.
Most researchers assume their data is clean.
After all, they have a fraud detection tool in place. Respondents are screened. Platforms are vetted. Quality checks are running in the background.
But what if those systems don’t agree on what “clean” actually means?
Data from our recent benchmarking study of the leading fraud detection tools suggests the assumption warrants a second look.
A test that challenges the status quo
To better understand how fraud detection tools perform in real-world conditions, EMI evaluated five leading platforms across three core audiences: consumer, B2B and healthcare. Each platform analyzed the exact same respondents across each audience under identical fielding conditions.
The goal was simple: remove variables and observe how each system behaves on its own.
What emerged was not a clear winner, but a strategy to improve data quality.
Same respondents. Very different outcomes.
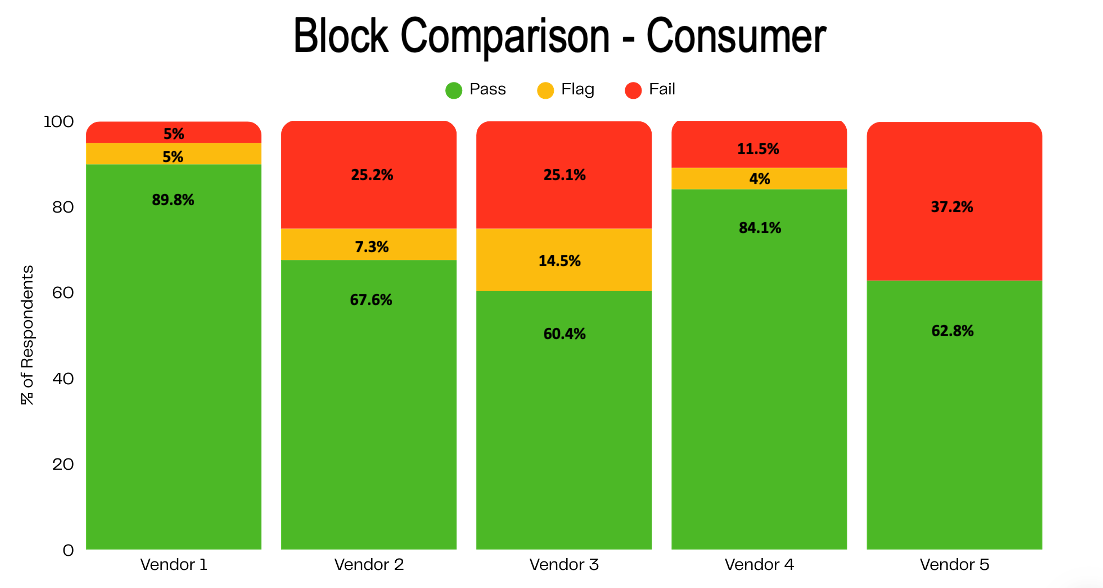
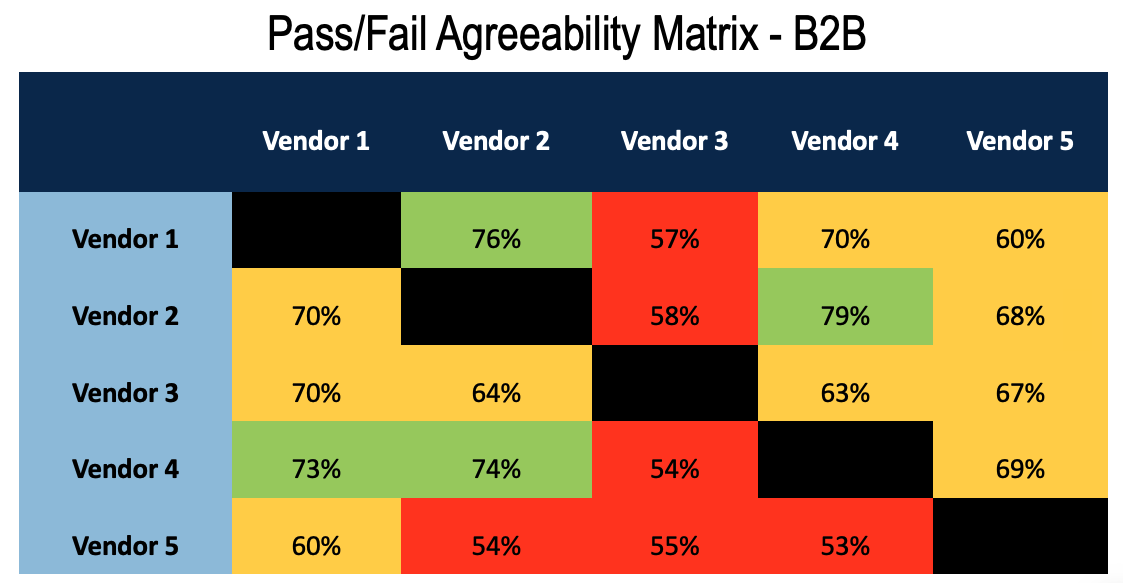
At a high level, the alignment across the five fraud detection platforms was mixed at best. In consumer studies, for example, a majority of respondents were consistently marked as good respondents across all systems, but there was significant disagreement in terms of what was poor quality.
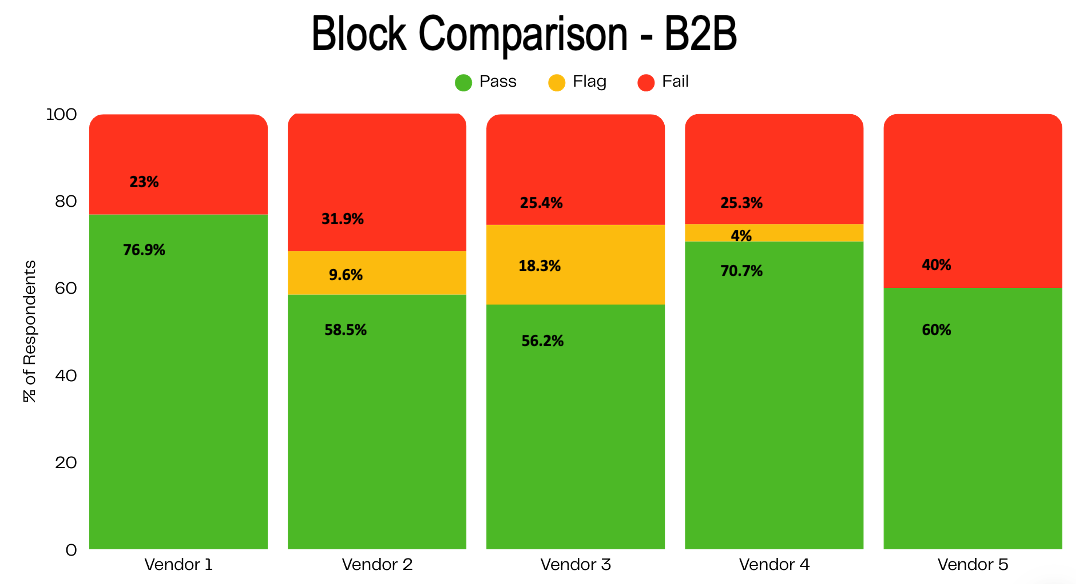
- Block rates varied by as much as 30+ percentage points across platforms, analyzing the same sample group.
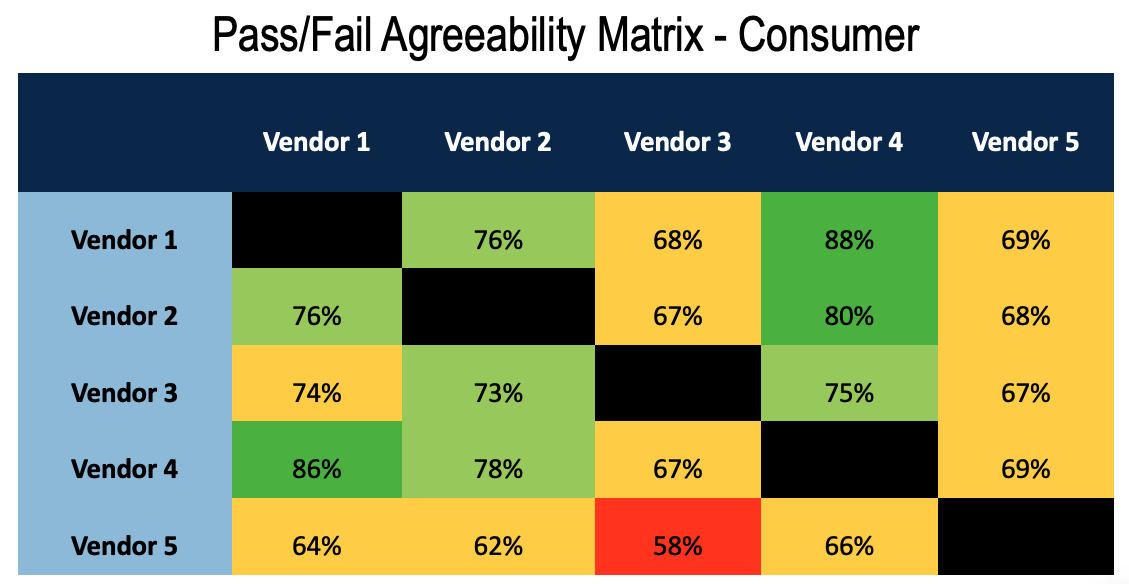
- Tools frequently disagreed on which respondents to exclude, not just how many.
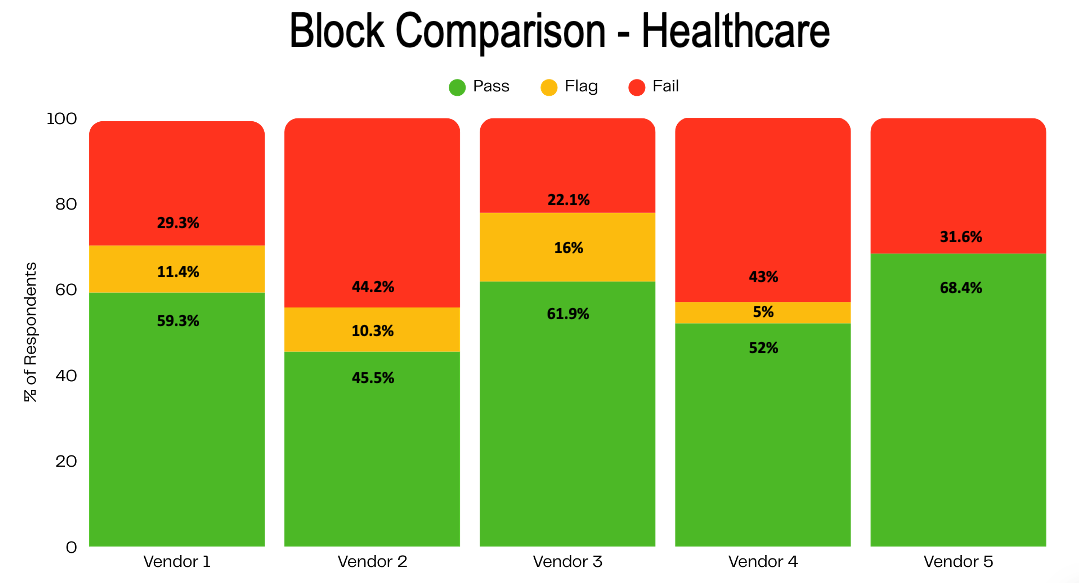
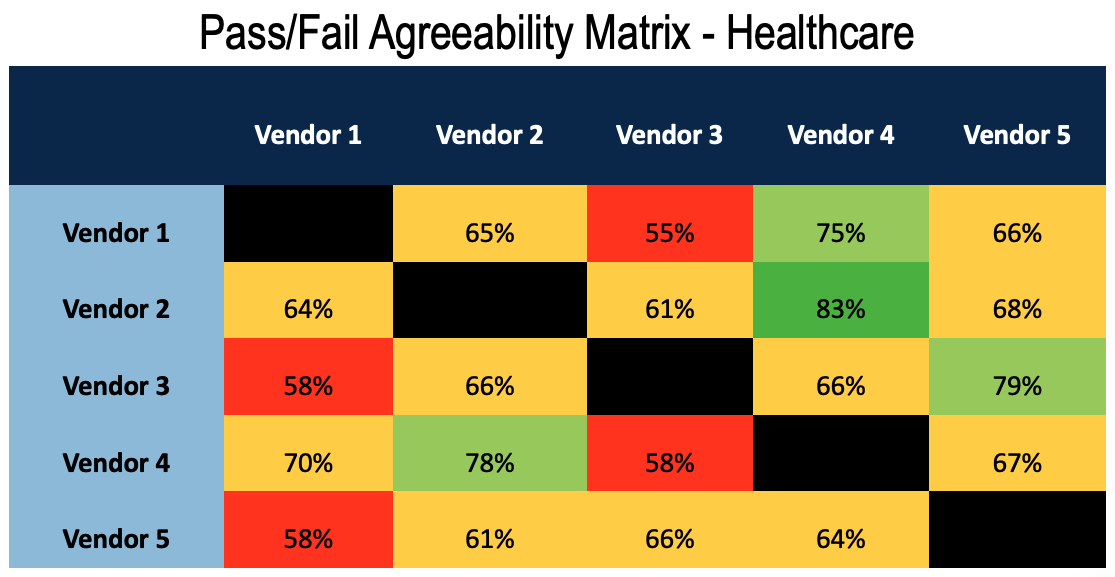
- Alignment declined significantly in more complex audiences like B2B and healthcare.
In healthcare specifically, pass rates ranged from just over 50% to nearly 70%, with notable disagreement on who qualified as legitimate.
The implication is difficult to ignore. The definition of “clean data” changes depending on the tool you use.
Why variation between tools matters more than you think
At first glance, variation between tools may seem like a technical nuance. In practice, it has direct business consequences.
- False positives remove legitimate respondents, reducing sample efficiency and increasing costs.
- False negatives allow fraudulent data to pass through, compromising insights.
- Differing definitions of fraud leads to different conclusions from the same underlying audience.
Two teams could field the same study, use different fraud detection platforms and arrive at materially different results.
This is not a theoretical risk; it is already happening.
The hidden complexity of modern fraud
Part of the challenge lies in how fraud itself has evolved.
Today’s fraudulent respondents are not limited to bots or obvious bad actors. They include:
- Scripted participants mimicking human behavior.
- Users operating through VPNs and proxy networks.
- Sophisticated personas designed to pass B2B and healthcare screeners.
- AI-assisted respondents generating coherent but fabricated answers.
Fraud detection systems attempt to identify these risks across multiple dimensions, including behavioral signals, device fingerprints, network data and identity validation.
But no system captures all of them equally.
The core problem: There is no universal definition of fraud
The benchmarking results revealed a fundamental issue: Fraud is not universally defined across platforms.
One system may flag a respondent for proxy IP usage. Another may pass that same respondent based on consistent behavioral data.
In B2B and healthcare studies, this divergence becomes even more pronounced, where identity verification is inherently more difficult and signals are less definitive.
Even when platforms agree on the extent of fraud, they often disagree on who the fraudsters are.
This fragmentation creates a scenario where:
- “Clean” datasets are tool dependent.
- Overreliance on a single system introduces blind spots.
- Fraudsters can exploit gaps between detection methodologies.
The shift from single tool protection to a layered strategy
If no single platform can deliver consistent protection, the implication is clear: Fraud detection is not a tool; it is a system.
The most reliable outcomes emerge not from choosing the “best” platform, but from combining multiple approaches that address different risk dimensions.
This is where a layered approach becomes essential.
What a layered approach actually looks like
A modern data quality strategy typically includes:
1. Multiple detection technologies. Combining platforms with different methodologies increases coverage and reduces blind spots. Overlap between systems is not redundancy, it is validation.
2. Complementary signal types. Behavioral, technical and identity-based checks each capture different forms of fraud. Together, they create a more complete picture.
3. Human oversight. Automated systems are effective, but not infallible. Analysts play a critical role in reviewing edge cases, refining thresholds and identifying false positives.
4. Transparent processes. Clear documentation of how data is cleaned – and why – builds trust with clients and stakeholders.
5. Transparent coordination among sample providers, research firms and clients. Coordination across all stakeholders is key to ensuring that there are no questions around definitions of quality, tools and processes being used, and what the impact is. This ensures that all involved have the highest level of confidence in the data, and the insights derived from it.
If you’re using one tool, you’re exposed
The industry has made significant progress in fraud detection, but the problem is far from solved. What this benchmark demonstrates is not that existing tools are ineffective – but that they are incomplete on their own. Each platform brings value. Each also has limitations. Relying on a single solution assumes those limitations do not matter.
The data suggests otherwise.
The next phase of data quality will not be defined by better individual tools, but by how effectively they are combined, layered, validated and continuously refined.
Because in today’s environment, clean data is not a feature. It’s a system.