
Editor’s Note: Charles R. Hammerslough is discipline lead for data science at VSA Partners, a Chicago-based branding and advertising agency.
Limited-service restaurants (LSRs) are fast-food and fast-casual dining establishments. Marketers who specialize in LSRs often employ marketing research to evaluate hypotheses about their brands or to detect segments within their markets. An additional purpose of marketing research is to understand the total structure of a market and to find out what guests consider important about the LSR experience. Without understanding the way that LSR guests think, marketers fly blind when deciding what menu or service innovations will appeal to guests. Fundamental MR helps with brand positioning and allocating marketing resources (marketing mix analysis) and also in generating unexpected directions for additional research.
Unsupervised Bayesian belief networks (BBNs) are a powerful innovation that allows the analyst to approach the underlying structure and dynamics of their marketing research data without preconceptions. The most important strategic questions that marketers ask are nondeterministic: “What is the structure of our market in terms of consumers’ attitudes?” “What are the key facts to know about the consumer that characterize the underlying purchase process?”
Description and exploration
Typical methods for description and exploration are univariate analysis of data variables and an exhaustive search through all possible bivariate correlations. Analysts often use multivariate methods such as cluster analysis or variable reduction such as principal components to explore data.
Below I will illustrate a newer tool for unstructured exploration, BBNs, which were developed in the 2000s. BBNs use the paradigm of knowledge representation to simplify any data structure into its essential elements. This method can be applied to both unstructured and structured data sets, such as marketing surveys. BBNs generate an inference structurethat represents each data variable as a node in a network. Each node is probabilistically conditioned on the values of a parent node and connected to the whole through arcs. In addition to the network structure discovered by the algorithm, we can examine the overall influence of each node, called nodeforce, which is roughly the overall strength of correlation of a variable with the rest of the network.
Data
The data underlying the network below were a set of 67 attitudinal questions asked of 2,294 guests who had visited LSRs in the previous four weeks. The questions were grouped by domain areas such as service, food, convenience, future, company and brand. The question groups were created by the researchers – the BBN algorithm had no prior knowledge of how the questions were grouped. All data were attitudinal questions of rated agreement or importance across a five-point Likert scale.
Two analyses of the modeled network are relevant: node interconnection and node strength (or influence). The first is the analysis of the overall structure and interconnections of the BBN. Highly interconnected nodes are often gateways to other domains of attitudes. In probabilistic terms, the value of many attitudes is conditioned on the value of key nodes.
An influence analysis measures the overall strength of each node or variable (an individual attitude) on the network as a whole. Highly influential nodes show which factors affect how LSR guests evaluate the available restaurant options. The influence analysis supplements the interconnection analysis in giving an overall picture of the influence of attitudes on the network and market as a whole.
Analysis of structure
Figure 1 shows the unsupervised network derived from the survey data on LSR attitudes[1]. Each question domain is colored differently for clarity. The first thing to notice is that the network algorithm discovered the similarity of the different question domains without any advance knowledge. For example, the network groups all of the questions about “future” of the brand to the lower left of the graph and most of the “food” questions are grouped to the far right or upper-left. Running down the spine of the graph are all of the brand attitude nodes. Recall that the network algorithm has no prior information about the structure of the questions – it discovered it independently!
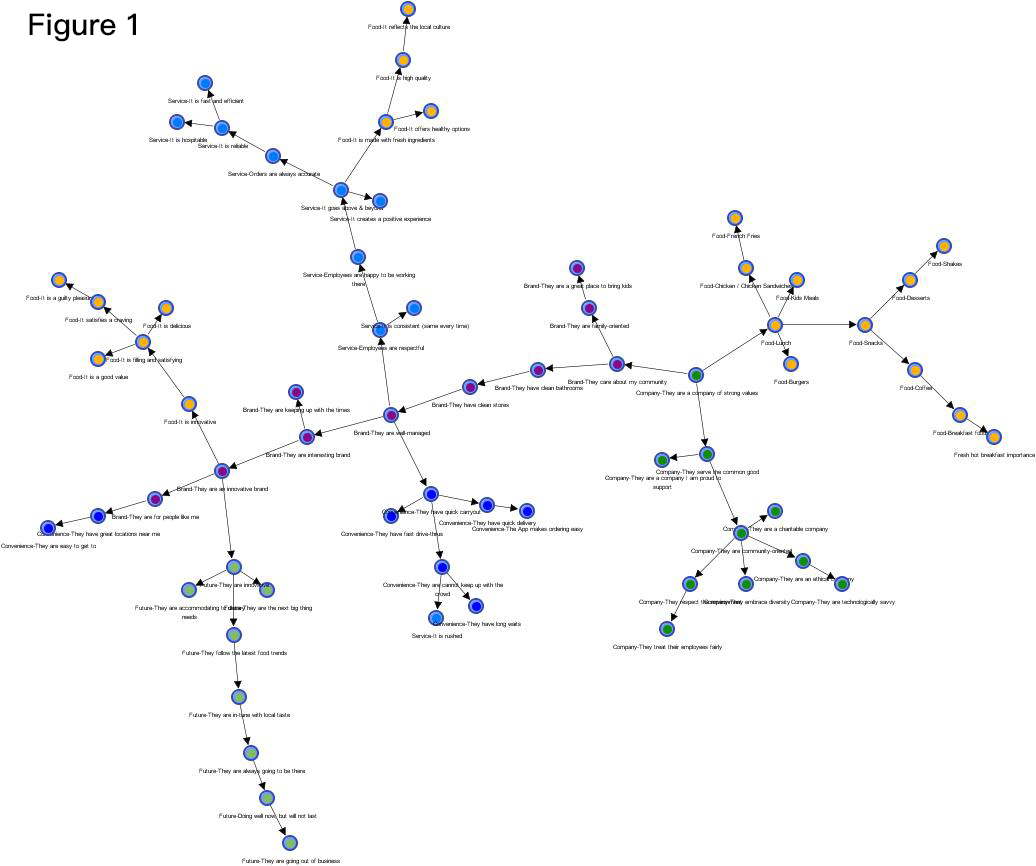 The nodes (or variables) that have a lot of interconnections are worth special note. The large number of connections implies that this node is the gateway to understanding through inference the dependencies within the network structure.
The structure of the gateway nodes give insight:
- Consumer answers to the brand node, “They are well-managed” is a gateway that influences perceptions of service and convenience. This makes sense because good management influences all aspects of a restaurant experience but especially service and convenience, as well as perceptions of food safety.
- “They are an innovative brand” conditions the view of the future of the brand, as well as perceptions about how innovative and satisfying the food is. These are general attributes about the sense of how good the food is, rather than an evaluation of specific menu items.
- “They are a company of strong values” is the company attribute gateway to the whole set of brand-, company- and menu-specific food questions. Lunch is the key to understanding attitudes toward the rest of the menu.
Analysis of node strength
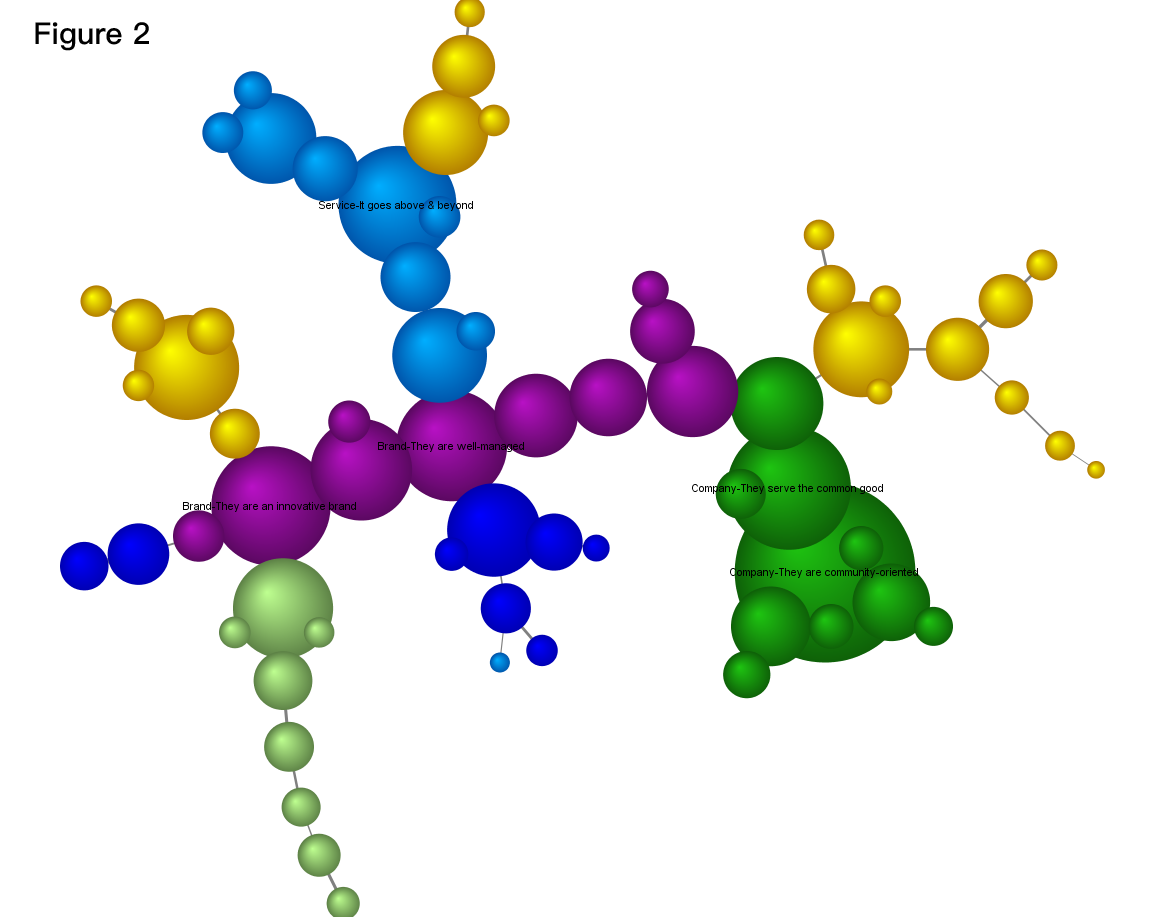
Figure 2 displays the same network graph as before, with the node force shown as proportional to the radius of each node, represented as a sphere. Only the top five nodes are labeled.
- “Company: They are community-oriented.” This is a surprising finding but community relations appear to be the single strongest influence on market structure and brand perception.
- “Company: They serve the common good.”Again, the importance of doing good for the community is a strong influence on the entire market structure.
- “Brand: They are well-managed,”and “Brand: They are an innovative brand.” Understanding virtually everything about how consumers differentiate between LSR brands – brand perception, future orientation, service, convenience and food satisfaction/value – runs through these two nodes.
- “Service: It goes above and beyond.”This influential node conditions perceptions of food quality and other service attributes such as experience, accuracy and operational efficiency.
Implications for brand marketing strategists
The network analysis informs a strategy for allocation of marketing resources and suggests some questions for future research. The results demonstrate that consumers are paying attention to how well a brand treats its community and whether it is perceived to be serving the common good. Some LSR brands are employers of choice in their communities and constructively engage in charitable and community activities. Brands that already engage with their communities should increase or redirect their brand message to highlight these activities. Other LSR brands might consider increasing their community involvement or seeking high-profile community activities and partners.
The other results highlight the importance of consumers’ perceptions of a restaurant being well-managed and innovative. Marketing often creates a deliberate image and story for the brand; it is up to the management of each unit to provide a consumer experience that is consistent with the brand marketing messages of cleanliness, innovation, convenience and food quality.
Lastly, BBN can pose some questions that lead to fruitful additional research. For example, do consumers really think of restaurant food as providing three distinct domains of experience: the quality of the menu items; the health and cultural aspects; and the deliciousness/innovation? Why does brand perception of innovation condition all further discussion of the future of the brand? What exactly do consumers mean by well-managed? Are there unexplored areas of strength that my brand should better communicate and what would be the effect on intention to purchase?
Tips for market researchers
- The BBN technique is best used (and most interpretable) for surveys or sections of surveys containing fewer than 100 questions.
- BBNs are executed using specialized software packages, in this case BayesiaLab. A number of other packages are available that will perform unsupervised learning, as well as routines available for R and Python.
- The software handles both categorical and continuous-valued variables equally well and can mix the two. The package used provides automatic binning routines for continuous variables.
- BBNs are a highly compressed format for visualizing a whole marketing research data set as a network. Part of its strength lies in sparking conversations about market structure and discovering unexpected associations and avenues for new research.
- BBN analysis has proven to point the way toward potential market niches that can be occupied by products.
Powerful tool
I’ve taken a brief look at a little-used yet powerful exploratory tool for understanding the underlying structure of marketing research data. Additional understanding generates unanticipated insights from data – in this case, a consumer survey of what differentiates LSR restaurants in the minds of consumers as well as the overall market structure in the mind of consumers. The results of this example speak to how consumers differentiate LSR restaurant brands in their minds. The results show that main perceptual differentiators in the market are: community-orientation and common good perceptions; perceptions of management quality and overall innovation; and a perception that service at the restaurant goes above and beyond.
The tool used above is an unsupervised BBN, which takes a knowledge representation approach to displaying the underlying core inference structure of the data set. The BBN had no prompting or prior information on the different categories of questions asked. It found it on its own and constructed a network tree that neatly differentiates each major section of the survey.
[1]BayesiaLab Unsupervised Learning: Maximum Weighted Spanning Tree