Does tech connect the dots?
Tim Macer is managing director and Sheila Wilson is research associate at meaning limited, a U.K.-based consulting firm.
The FocusVision 2016 Annual Market Research Technology Report is the latest issue of a study carried out since 2004 by our firm, London-based meaning. Every year this annual survey of technology across research companies uncovers a few surprises. Some of these, such as CATI losing its place as the industry’s second mode of choice this year, confirm wider changes in the industry. Some – like the spread of storytelling, the use of visuals in online surveys and evidence that MR is facing up to big data and embracing it – show encouraging and reassuring developments. Others, like difficulties with the dissemination of knowledge through the industry about technological developments, or the limited progress higher-tech data-reporting methods are making, should give us pause. For this article we have picked out some of the more striking results from the newly-released 2016 report.
The report is based on a sample of around 220 companies around the world, conducted as a 15-minute online interview offered in five different languages during late December 2016 and early January 2017. The 2016 study is available to download at http://bit.ly/2pknci8 (registration required). Previous reports are available from meaning.uk.com.
Little real change
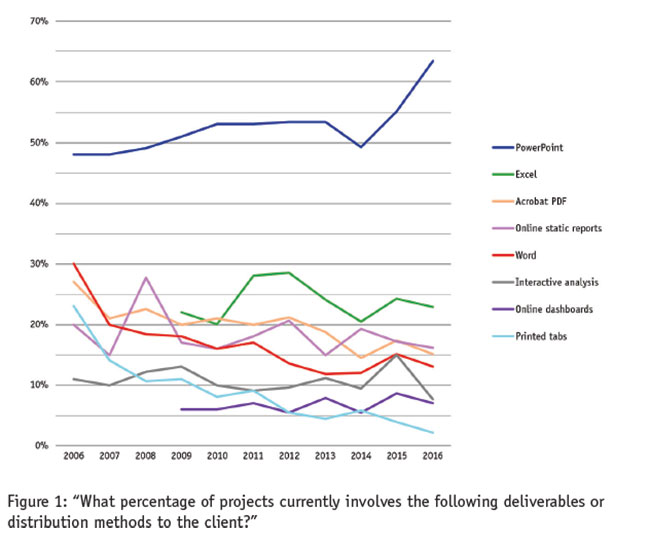
Since 2006, we’ve tracked the proportion of projects using the main results-delivery methods. To be frank, there has been little real change over time. Tables on paper and Acrobat PDF are falling out of favor but PowerPoint is surging ahead (Figure 1). There is no sign of a mass move towards high-tech delivery methods such as online dashboards or interactive analysis.

MR companies still seem reluctant to take the plunge with these advanced technologies, which we suspect relates to problems in monetizing them. We believe the industry is missing a trick. These tools can bring down operational costs by removing error-prone semi-manual processes and by allowing clients to run all those persnickety extra tables for themselves.
Nearly every year, 2016 being no exception, we see larger companies more likely to deploy the higher-tech results-delivery methods, particularly dashboards. They have greater resources and probably also the volumes to achieve better economies of scale. To deliver dashboards and infographics, you need a pipeline of creative, technical and analytical skills, which is easier for the larger firms.
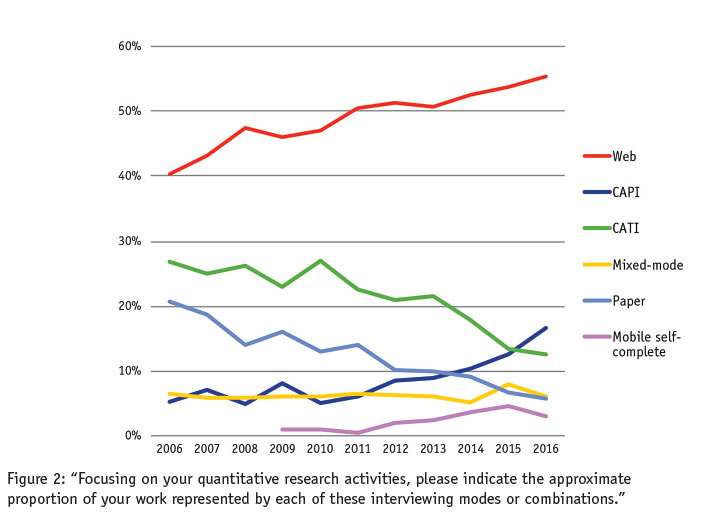
Also since 2006 we’ve asked companies what proportion of their survey work is fulfilled through each different interviewing mode. Here, the picture has changed dramatically. In response to the opportunities – and client-imposed pressures – to work faster, cheaper and better, interviewing continues to gravitate from CATI towards the Web.
Below this headline shift, the picture is more complex. In the earlier days of Web, some of its growth was also fueled by self-completion mail studies on paper switching to the Internet. We suspect most of these paper-based studies converted to Web interviews long ago: it’s now the other side of paper that is making the transition. In 2016, for the first time, CAPI overtook CATI to become the industry’s second interview mode (Figure 2). Paper may seem inexpensive but the administrative burden is high. Today, the availability of low-cost tablets and smartphones, and the ubiquity of Wi-Fi and cellular data networks, means there is a lot less resistance to overcome in moving face-to-face interviews from paper to CAPI.
Storytelling is well-embedded
In a new question this year, we asked companies how many of their projects now use storytelling. The mean average share of projects across all companies appears in Figure 3. It shows that storytelling is well-embedded as a method across the industry. In contrast to the effort of introducing new technologies such as dashboards or interactive analysis portals – which are not enjoying such popularity – storytelling is a low-tech, low-cost way to bring the results to life. We suspect this has influenced its success.
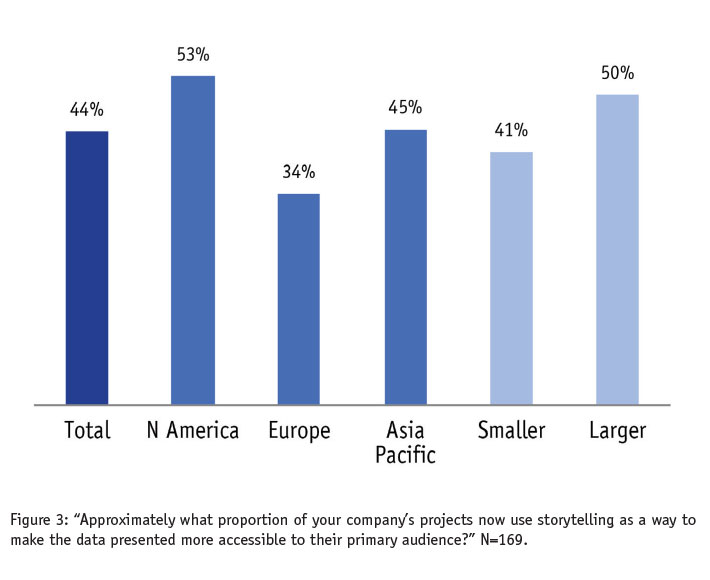
Larger companies are more likely to use storytelling than smaller ones. There is also an observable difference across the regions of the world, with North America reporting its use on more than half of projects, while it is only a third of projects in Europe that currently get a narrative treatment. It is a global difference we are at a loss to explain.
Visualization of data has received a lot of attention in the industry but we also wanted to look at how firms are visualizing other areas of research.
In one question (not shown here) it turns out 90 percent of companies say it’s important to make online surveys more visual in appearance. We asked them what kind of visual components they use in surveys (Figure 4). We are heartened to see that many have tried interactive graphics and a few have also used augmented reality, which is truly innovative.
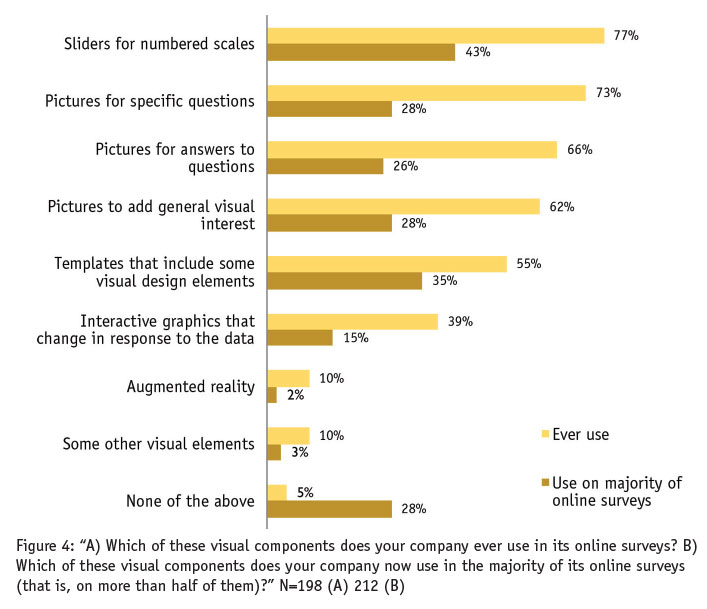
However, more than a quarter (28 percent) don’t normally use any visual elements in surveys. We suspect this is influenced by cost and time, as it takes effort and special skills to make surveys look beautiful across all the devices they are likely to appear on today.
Not innovative
In 2015, this annual survey discovered many research companies did not consider themselves, nor the research sector in general, to be technologically innovative. It also found research companies to be relying heavily on their technology providers as a source of innovation. This year we wanted to better understand some of the barriers and what technology providers need to do to help research companies know more about new innovations, as they become available.
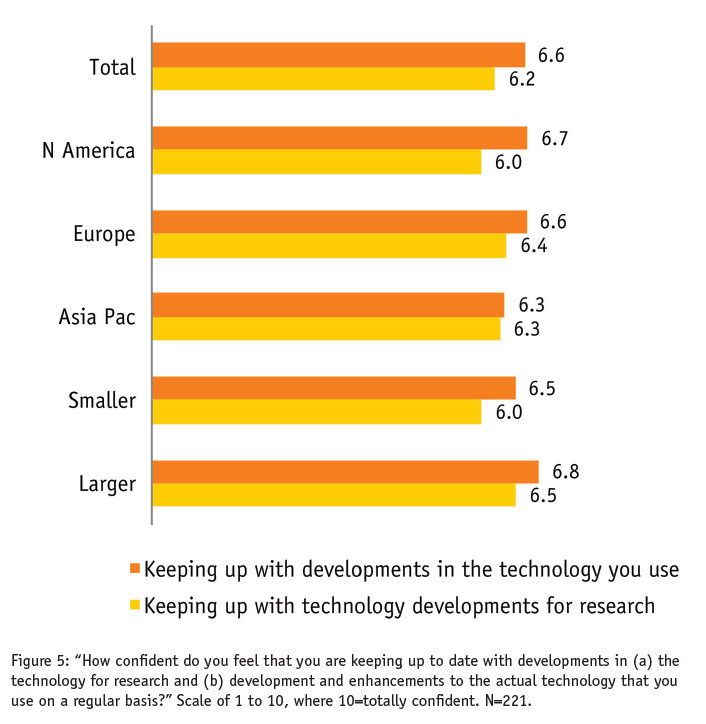
We find research companies are not very confident in keeping up to date with technological development in the software they use and even less so with industry advances, as is apparent from the low scores in Figure 5. While North American firms are the least confident in staying abreast of industry-wide developments, they are slightly more confident than others on knowing how the technology they are using is developing.
In a different question, we asked about participants’ favorite ways to find out about technology innovations. Webinars from technology providers were slightly ahead of conferences and trade shows. This is especially true in North America, though in Europe, industry events topped Webinars, while in Asia-Pacific, firms are more receptive to hearing it directly from their providers. In further questions on this topic, we found the tech-savvy participants to this study aim to spend about six hours a month specifically on keeping up to date with technology developments. Unfortunately, some 42 percent admit they don’t usually hit this target.
Concerns about the rate at which technology continues changing come high among the barriers research companies identify in learning more about what technology can offer. None of us can control the rate of change but anxieties will be magnified if you don’t manage to put in all the time you intended to find out what’s happening, as many firms admitted. Despite this, what tops the list is something that technology providers can address – and they need to. Research firms singled out pushy sales tactics as the No. 1 obstacle (Figure 6). In verbatim comments, companies said they wanted to see more evidence to back claims, more real-life case studies and less “snake oil.”
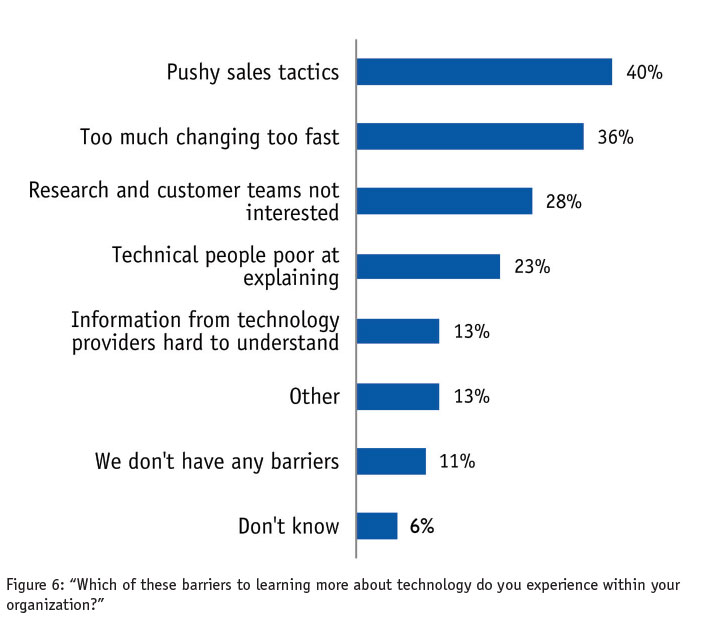
While we know that many technology providers will bristle at the suggestion that they place the pursuit of the sale above the needs of customer, research companies are saying this is happening too often, and when it does, it gets in the way of them learning, innovating and, ultimately, investing in the technology. Providers need to trust their products more and make what they do – and how they do it – more apparent.
Embracing big data
Big data continues to be big news in the research industry, though stories are increasingly about the pains of adoption. We wanted to gauge just how much the research industry is embracing big data and other unconventional forms of data – and what future these might hold, in the light of practical experience.
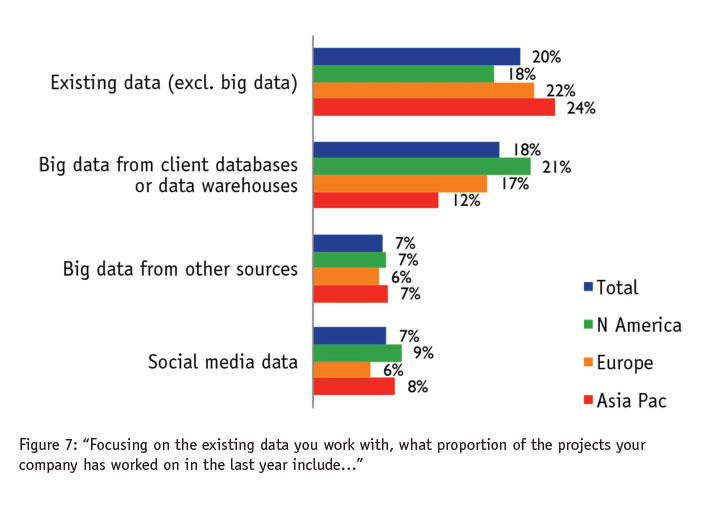
The 2016 survey tells us that while surveys make up 77 percent of the data that research companies work with, 9 percent now comes from observational data and a further 9 percent from existing data such as big data or social media data. We also find 43 percent of firms are now working with social media data, up from 17 percent from when we asked about this in 2010, when social media analysis was in its infancy.
Specifically, as shown in Figure 7, many projects now include some big data and around 7 percent refer to social media data – proportions that appear to be growing.
Handling big data is also viewed as a future core competency for research companies. In another question, we asked research companies how important they consider it is for them to offer big data analysis and interpretation. Forty-one percent of them think it is of high or the highest importance and this rises to a majority (57 percent) when looking five to 10 years ahead.
Companies also show clarity over differences in the impact that big data will have on qualitative and quantitative research (Figure 8).
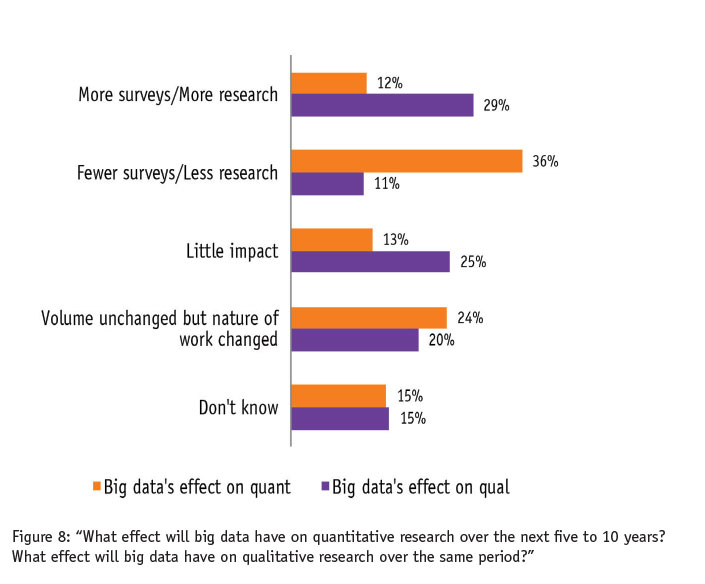
Qual is expected to be a long-term beneficiary of the growth in big data, while a different fate seems to await quant, with few seeing more quant work as an outcome. However, just short of half of firms think the impact will be negligible in volumes, though some of these believe the nature of qual work will change and rather more think it will change the nature of quant work. While views may differ over how this will play out, very few participants think the net effect will be less research in the long run.
Context and meaning
Whether realistic or not, viewed alongside the many other incremental changes this report identifies, it appears technology is allowing MR to see where it can bring context and meaning to a world where data is plentiful and cheap, time is short and budgets are perennially squeezed. Though our respondents indicated they could spend more time keeping pace with technology’s changes, they at least seem to be able to use it effectively to improve processes for themselves and their clients.