How to use Microsoft Excel’s Data Analysis TookPak
Editor’s note: Eric Cai is the senior data scientist at Acosta. This is an edited version of an article that originally appeared under the title “Using Microsoft Excel’s Data Analysis TookPak to Perform Correlational Analysis” on Generation.1ca.
Microsoft Excel is a useful point-and-click software for data entry, data analysis and data visualization. The Data Analysis ToolPak extension allows you to conduct many types of statistical analysis, such as regression, t-tests, ANOVA and random-number generation.
This article will introduce the concept of correlation and show how to use Excel’s Data Analysis ToolPak to perform correlational analysis.
Grocery data example
Suppose that a grocery store sells five products:
- Hot dogs.
- Pasta.
- Chicken.
- Chips.
- Ketchup.
The store records transactional data about the expenditures of each product in every customer visit. The table below shows the first five rows of data.
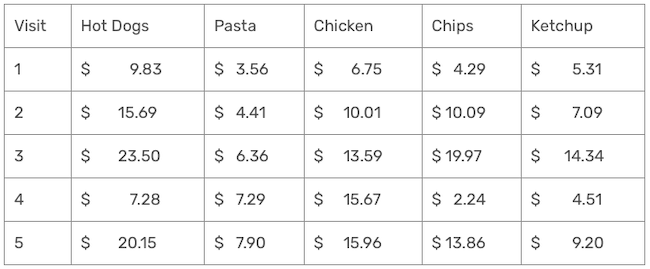
Note: The data above is simulated from a random-number generator. The correlations are unusually high for illustrative purposes only; they do not represent real business data.
The grocery store’s owner wants to know which products tend to sell well together. Correlational analysis can help in this situation.
What is a correlation?
The correlation coefficient is a measure of the strength of association between two variables. It can range from -1 to +1, and the sign indicates whether the association is in the same direction or in the opposite direction.
- An example of a positive correlation is the association between height and weight. Taller people tend to be heavier; thus, as height increases, weight tends to increase.
- An example of a negative correlation is the association between altitude and temperature. As you climb up a mountain, it tends to get colder; thus, as altitude increase, temperature tends to decrease.
- If the correlation is zero, then there is no association between two variables. An example of this is how much time you spend reading and the temperature on Mars. These two variables are separate and have no pattern of increasing or decreasing together.
The magnitude of the correlation coefficient denotes the strength of the relationship. In mathematical terms, you can get the magnitude by taking the absolute value of the correlation. A bigger magnitude denotes a stronger relationship. A correlation of -1 or +1 denotes a perfect correlation.
Calculating correlation coefficients using Excel’s Data Analysis ToolPak
Returning to our example of the five products in the grocery store, how can we use correlation to determine which products sell well together? You can obtain the correlation coefficient for the sales between each pair of products. A correlation matrix is a handy way of organizing pairwise correlation coefficients and the Data Analysis ToolPak can provide this matrix for you.
How to use Excel’s TookPak in eight steps
1. Click on the “Data” tab in the top menu.
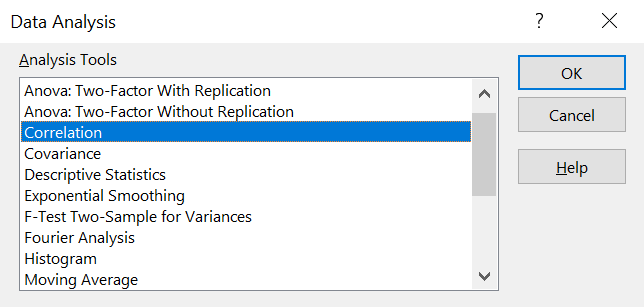
2. On the far right, click on the “Data Analysis” icon; that is the Data Analysis ToolPak. Below is an image showing what the entire menu will look like.

3. In this menu of analyses, choose “Correlation” and click on the “OK” button.
You should get this dialog box.
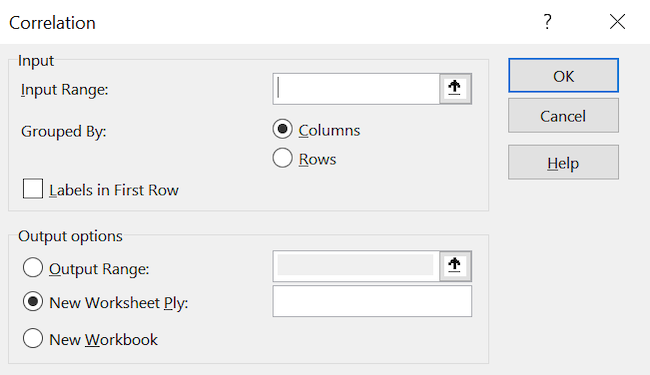
4. For the “Input Range”, highlight the five columns of data.
5. Make sure that the data are grouped by columns, which should be the default option.
6. Click on “Labels in First Row.”
7. The “Output options” section allows you to choose where to put the results of the correlation matrix. I suggest putting it two columns away from your data on the same sheet.
8. Once you finish entering all inputs, click on the “OK” button.
You should get this correlation matrix; the large correlation coefficients are highlighted in bold. 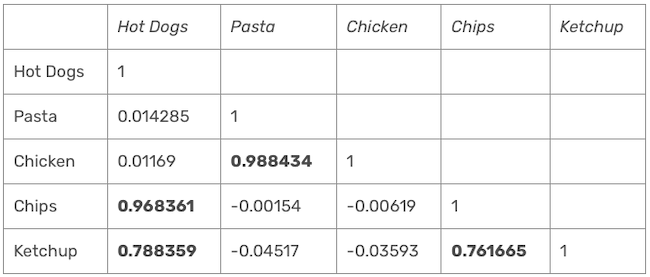
This analysis shows that the following pairs of products sell well together:
- Chicken and pasta.
- Chips and hot dogs.
- Ketchup and hot dogs.
- Ketchup and chips.
Given these results, it makes sense to
- Place chicken and pasta near each other to boost the sales of both products.
- Place chips, ketchup and hot dogs near each other to boost the sales of these three products.
Correlation is a statistical concept for exploring associations between variables. Using Microsoft’s Toolpak can help you solve your own problems in business analytics.