
Charting a course
Editor's note: Roger Green is president/CEO of RG+A, a New Hope, Pa., research firm.
 Increasingly, biopharmaceutical manufacturers bring value and earn revenue by improving the treatment of complex diseases. Agents entering these markets gain a significant portion of their revenue from second- and later-line therapies, frequently in combination therapies.
Forecasting later-line units and revenues for these agents presents unique challenges:
- Traditional allocation methods cannot absorb the complexity in treatment regimens and patient histories. Consider the endocrinologist asked to estimate the percentage of third-line patients initiating a specific GLP-1 therapy. The endocrinologist would have to estimate the percentage of patients that would be good candidates for GLP-1 therapy. S/he would have to reduce this number by patients who initiated GLP-1 therapy in second-line. Amongst the remaining patients, s/he would have to eliminate patients whose formularies preferred a different GLP-1 and those whose formularies mandated this particular agent. Finally, s/he would have to consider how many considered themselves unable to absorb the copay and, simultaneously, unwilling or unable to comply with the copay card program. For this estimate to be accurate, s/he would also have to factor out the effects of various recall biases. This is an exceptionally challenging calculation to get right within the minute of survey time we allow for an answer.
- Chart-pull studies provide more accurate views of the patients the study covers. However, these studies trade-off large costs against adequate sample sizes and frequently provide correlated variables that limit analytics. A typical study might include detailed exploration of five patients and a limited number of additional questions. This makes collecting the number of cases required for detailed analysis an expensive proposition. Data in most chart-pull studies demonstrate levels of correlation high enough to complicate multivariate analysis. Many include enough missing data, which makes analysis even more challenging.
Whichever method you prefer, these challenges present significant barriers in determining how second- and later-line treatment patterns will evolve as new agents enter market and clinical trial results highlight the value of novel combination therapies.
Patient simulation methods can address these issues but only if the simulation captures market complexity adequately. Many simulation methods fall short, particularly in the areas of patient complexity. Most researchers simulate patients in five to seven two- or three-level variables because an individual physician might not consider more than five to seven characteristics. This does not reflect the fact that different physicians consider different characteristics. It may take as many as 20 variables to incorporate the five-to-seven that each physician will consider.
In addition to being a more accurate representation of the decision process, increasing the number of variables allows the researcher to explore two issues:
Multiple ways to describe a broad attribute. The simple phrase “efficacy” or “safety” may represent multiple specific metrics. These may not carry equal weight in the mind of the psychiatrist, who may care more about how well a medicine treats positive symptoms of schizophrenia than negative symptoms – or vice versa.
Attributes that might affect prescribing indirectly or as secondary factors. The same psychiatrist who wants to see multiple descriptions of symptoms will want to track patient weight and blood sugar levels. However, s/he may also consider family cardiovascular history and rate of recent weight gain when prescribing, but these might not make a list of “seven most important.”
One method created to address this specific issue is line of therapy treatment simulation. In line of therapy simulation, physicians treat a patient from initial diagnosis through multiple lines of therapy. The patient description incorporates as many as 25 clinical, demographic, insurance and motivation-based variables. It evolves through rounds of therapy to incorporate variability in clinical response to whatever regimen the physician prescribes and associated changes in the patient’s condition. Prescribing choices will mimic the entire range of possibilities the prescriber considers, ranging from watchful waiting through complex therapies to palliative care.
A typical study will include three to four different simulations. The first one will measure current market behavior, followed by two to three rounds of future events spaced 12-18 months apart. Each round will include new product introductions or indications, publication of clinical studies describing advances in combination therapies and changes in reimbursement rules.
The core analytical package for line of therapy simulation focuses on predicting how market shares will evolve as new products and information enter the market. Analytics not only produce share forecasts but also: source of share analysis across time periods; common multi-line prescribing patterns and the frequency for each pattern; and prescriber segments that are most likely to prescribe each multi-line pattern and patients that are most likely to be treated with that pattern.
Other analytics can identify the patient, physician and product perception characteristics that have the greatest impact on treatment decisions at a given line of therapy.
Case study: Oncology
Message: Absent simulated prescribing, hypotheses that seem reasonable are often wrong.
Our client acquired co-marketing rights to a new asset one year before its launch in a key target market. The product treated a tumor type where most patients exhibit one of four biomarkers. Call them A, B, C and D. Well-established in-market agents treated patients exhibiting A or B. A different agent had recently received an indication to treat patients exhibiting C. Our client’s product treated patients exhibiting D.
The study was designed to provide a five-year forecast, key prescriber segments and value drivers for creating promotional messages. Client forecast anticipated an aggressive first-line share among targeted patients. The line of therapy simulation estimated a similar share but across three lines of therapy. By tracing treatment patterns across lines of therapy and patient types, the simulation model identified potential share slippage not included in the client model.
The key issue involved treatment patterns for patients expressing multiple biomarkers. Patients could exhibit high levels for 0-4 biomarkers. The client forecast anticipated that patients expressing Biomarkers A (the most established marker) and D (client product) would divide share between the two agents, while patients expressing high levels of D and B or D and C would receive the agent for D.
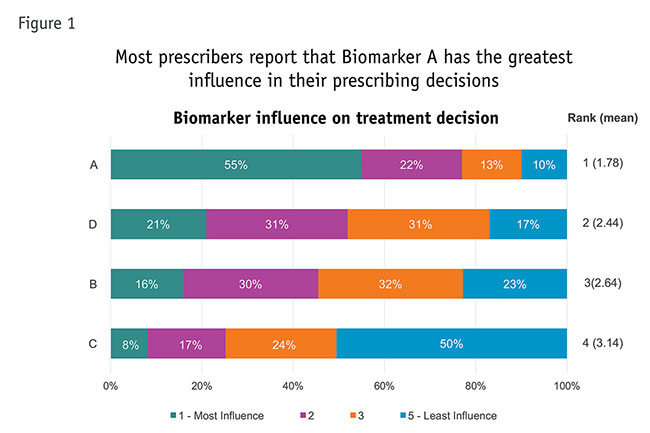
The simulation study asked prescribers to rank relative influence of the four biomarkers on the treatment decision. Prescribers indicated that A was the most influential biomarker, B and D were comparable and C was far weaker (Figure 1).
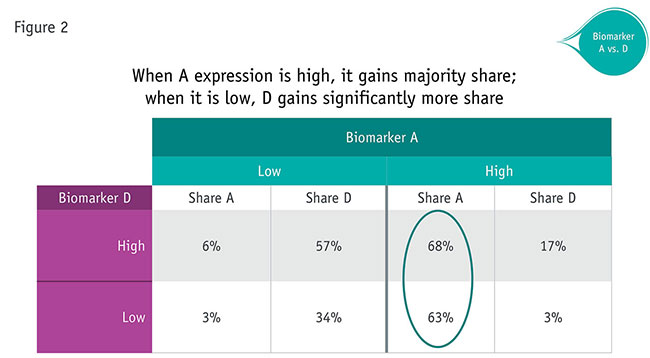
Results of a multi-line treatment simulation revealed different, more complex patterns. Competition between Biomarkers A and D reflected expression of A. When the patient expressed high levels of A, A received far more prescriptions than D, even when D expression was relatively low (Figure 2). This finding is consistent with how much influence prescribers felt expression of A would have on their decisions.
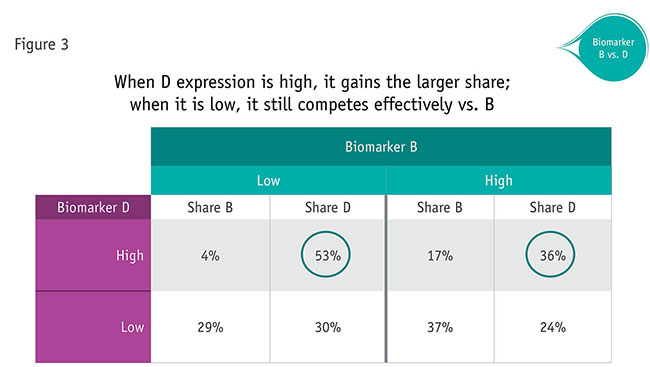
Competition between Biomarkers B and D produced different patterns (Figure 3). Whenever D was high, it received far more share than B. When D was low, it still achieved share between 24 percent and 30 percent (comparable numbers for A when it was low were 3 percent and 6 percent). In fact, high, D performed only slightly better when biomarkers were both were high (36 percent) than when both were low (30 percent). The degree to which D levels drove prescribing are surprising, given that prescribers stated the two would have roughly equal influence.
Conclusion: Simulating patient treatment across multiple lines of therapy can produce benefits in forecasting, modeling and value driver identification.
Level of insight
Forecasting patient treatment across multiple lines of therapy can provide a level of insight that conventional techniques cannot match. This approach should work well in any complex multi-line disease, including oncology, hematology, autoimmune disease, diabetes and CNS diseases.