
Little things mean a lot
Editor's note: John Goodman is vice chairman of Customer Care Measurement & Consulting. He can be reached at jgoodman@customercaremc.com. Sally Hurley is CEO of VIPdesk Connect. She can be reached at sally.hurley@vipdeskconnect.com. Thomas Hollmann is executive director, Center for Services Leadership and clinical associate professor of marketing at the W.P. Carey School of Business at Arizona State University. He can be reached at thomas.hollmann@asu.edu. Scott M. Broetzmann is president and CEO of Customer Care Measurement & Consulting. He can be reached at scott@customercaremc.com.
Researchers have correctly focused the bulk of customer experience (CX) measurement resources on the dissatisfied end of the continuum. John Goodman and Marc Grainer of Customer Care Measurement & Consulting’s (CCMC) team led the original White House-sponsored research in the 1974-1984 time frame on complaint-handling.1,2 Business Week noted that, “Sparked by some landmark studies commissioned by the White House Office of Consumer Affairs….a new attitude has been born….” Our models included quantification of the payoff of improved loyalty and for winning new customers via word of mouth (WOM) using broad, conservative assumptions. B. Joseph Pine and James Gilmore, in their book “Experience Economy,” initiated scrutiny of the other end of the spectrum: delight.3 They tell of the Nordstrom store where a woman demands and is given a refund for tires not bought at Nordstrom (she bought them at a tire store that used to be at that location). Finance executives suggest that a refund in that case was inappropriate.
Further, Matt Dixon, Karen Freeman and Nicholas Toman (Dixon, et al.), titled their article in the July 2010 Harvard Business Review, “Stop trying to delight customers!” arguing that a delight strategy is almost never cost-effective.4 Dixon, et al., report the results of a comparison of customer loyalty of satisfied vs. dissatisfied customers, not delighted customers. This is a critical research and measurement issue. Satisfied customers are customers whose expectations have been met. On the other hand, a delighted customer is usually defined as a customer whose expectations have been exceeded. Therefore, the case presented in the Dixon, et al., article is potentially not applicable to the central topic of customer delight.
The past decade has seen a surge in literature on how to create delighted customers by managing staff to deliver it but the measurement aspect has been deficient. Further, much of the literature suggests a range of delight actions but no one has attempted to create a complete taxonomy of delight actions or determine the relative impact of delight actions. A goal of always exceeding expectations is unrealistic and can demoralize frontline staff with no hope of ever meeting the stated objective.
CCMC and Arizona State University’s Center for Service Leadership (CSL), at the suggestion of and supported by VIPdesk, has conducted the first rigorous study of the range of delighters and their impact. While not comprehensive or perfect, it does raise important issues for the CX, service and marketing professions on measuring and managing delight as well as measurement challenges for market research professionals. Specific findings include:
- Delight does deliver significant loyalty, margin and WOM benefits.
- Digital channels appear to be as powerful as in-person or telephone channels.
- Delight can be inexpensively implemented in several discrete manners.
- Delight must be measured separately from satisfaction across all channels.
- Better metrics/methods are needed for quantifying WOM impacts.
Here we share our methodology, key findings and implications for action.
Methodology
CCMC and CSL surveyed a sample of 2,519 households with incomes above $100,000 derived from a commercially available panel. The sample was projectable on the U.S. population from a gender and geographic perspective. Respondents were asked if they had experienced delight in their interactions with a company in the last six months. If they had experienced delight, they were presented with a list of 15 delight actions, each accompanied by an example. The list was derived from a taxonomy presented by Steve Curtin in his book, “Delight Your Customers,” to which we added eight more categories based on several surveys where we asked for a verbatim description of the delight experience.5 An “other” category was also provided.
About two-thirds of the total panel reported at least one delight experience. Customers experiencing delight reported an average of 3.5 delight experiences. These customers were then asked to identify the experience that produced the most delight and the industry or product area of the delighting company. The remaining third of customers who had not experienced delight were asked about their “best” service experience. Both delighted and non-delighted respondents were asked their primary communication channel used during the delight experience. Four market actions were measured including likelihood of future repurchase, WOM, social posting and willingness to pay more for the same product or service from that company. Finally, within each industry, comparisons were made between the loyalty of respondents that were delighted and the remaining non-delighted respondents to estimate the increase in top-box loyalty associated with the delight experience. Verbatim comments provided additional detail.
One area explored in more depth was the impact of WOM on the actions of those receiving the referrals in-person (as opposed to online postings). Our usual question asking how many people were told about the experience was followed by a second question asking, “Of those told, how many, to your knowledge, took action on your referral?” We found that about half of respondents say they do not know but the other half provide relatively consistent data. For satisfied customers, usually between 20 and 30 percent of customers are reported to act. While this information is somewhat speculative, companies ranging from airlines to gaming companies have felt it is at least directionally correct. This question allows us to translate WOM into an estimate of new customers won from referrals. It parallels research conducted by Keller-Fay on digital WOM impact on sales.6
Key findings
Honesty and transparency are powerful delighters.
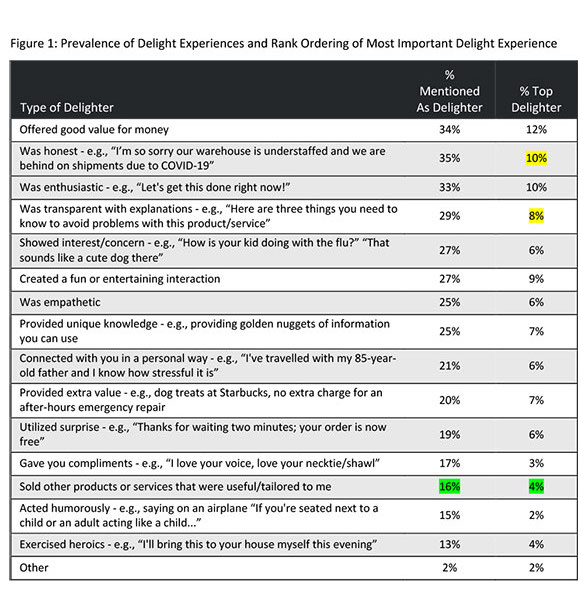
Customers want to know the limitations of products and services they buy. Therefore, honesty and transparency, highlighted in yellow in Figure 1, are two of the top delighters. This is especially important in industries with complex or confusing products and contracts. For instance, in the auto industry, honesty and transparency are as important in producing delight as getting a great price. Likewise, transparency and honesty are strong delighters for e-commerce, financial services and medical care. The right column in Figure 1 shows the rank ordering of the most important type of delight experienced by consumers.
Cross-selling is a major delighter.
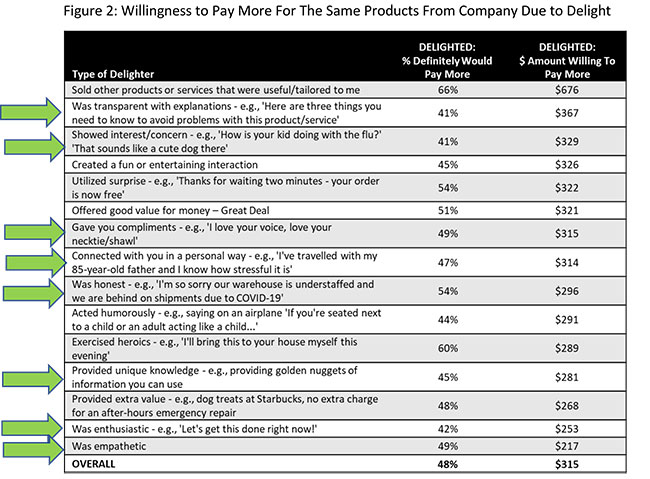
As noted by the green highlight in Figure 1, 16 percent of consumers mentioned being delighted by being cross-sold other products. In Figure 2, we show that, of those delighted by a cross-sell, 66 percent indicated they would pay more for the same products from that company. Note that the amount willing to be paid is the average across all product lines including auto and fashion, explaining the seemingly high amount presented. The critical requirement is that the cross-selling is appropriate and tailored to the customer, which means that the CSR must know what the customer already has, and their needs, based on their persona or history.
While customers do not usually like sales pitches, if they feel you are trying to accessorize or help resolve a current gap in the overall experience, they will welcome the suggestions and walk away feeling delighted. For example, Harley-Davidson finds most riders want to personalize their motorcycle and are enthusiastic about spending a great deal, often as much as the basic price of the bike, on chrome and other accessories.
Delight can be delivered cheaply via customer service representatives’ actions, behaviors and words.
The 15 approaches to delight range from inexpensive transparency, patient/detailed explanations and tailored experiences delivered by empowered employees to enthusiasm and quirky humor – and to more costly actions, such as surprise freebies, discounts and very low prices.
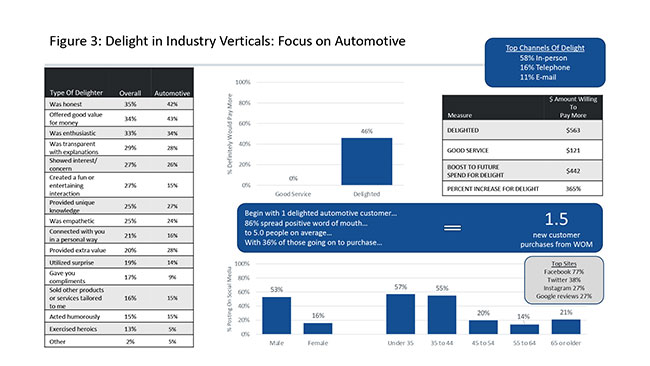
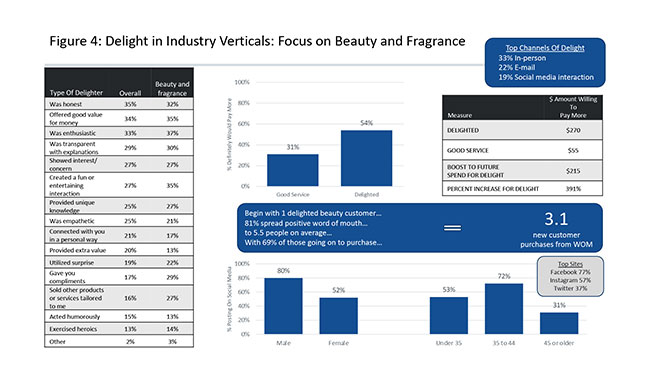
In the 15 approaches listed on the left-hand column of Figure 2, the eight with green arrows are produced by customer service representative (CSR) communication/interaction with the customer and have no tangible cost beyond the application of creativity by the CSR and their talk or typing time expenditure. This figure also shows the percentage of customers experiencing a particular delighter who indicated they would pay more for the same product from the same company based on being delighted. Again, the amount paid is the mean across all product lines. Figures 3 and 4 provide data specific to auto and e-commerce markets. Surprisingly, the CSR behaviors produced almost exactly as many customers willing to pay more as the more costly “great deal” and “freebies” (42-54 percent vs. 48-51 percent). Finally, the experience that leads to the most consumers willing to pay more (66 percent) is being cross-sold other products that were useful, which produces more revenue.
Delight can be achieved by personal interaction as easily as monetary means. For many delighters, the only expenditure required is the time to listen and then respond with emotion and information. The eight actions highlighted with green arrows are all low-effort but very effective delight actions.
What action creates delight can also vary by customer and can often be literally opposite experiences tailored to the customer. For example, one of the authors arrived on the club floor of a five-star hotel in Tokyo at 7 a.m. and looked for the usual coffee urn to grab a quick cup of coffee. There was not one in sight. We were approached by a staff person who asked if we wanted some coffee. When we said yes, they went in the back room and came out in two minutes with a fresh-brewed (though rather small) cup of coffee. We drank that in two minutes and asked for another. Again, a two-to-three-minute wait; same for the third cup. We finally asked why there was no large coffee urn. “That would not be personal service and we want to provide personal service,” was the reply. Personal service could include providing coffee both ways, so that two different segments can be simultaneously delighted.
Word of mouth and intention to repurchase from delighted customers is more impactful than WOM from satisfied customers.
In past studies, we found that satisfied customers will tell several friends and acquaintances about their satisfactory experience. When we take the next step of asking, “To the customer’s knowledge, how many of those told about the satisfactory experience actually act on the recommendation?” we found that about 20 percent of those told are reported to have taken action. In this study of delight experience and resulting market actions, results for the same question show that, across all industries, an average of 50 percent of those told about a delight experience were reported by the respondent to have taken action on the recommendation. The range was 36 percent for auto to 69 percent for beauty and fragrance.
This means that if six people are told (a median across all industries), at least two people act on the delight recommendation. This is twice the reported impact of WOM from customers reporting good or satisfying service.
Figures 3 and 4 show the possible quantification of the impact of a delight experience for the auto and e-commerce industries based on the subsamples from those two industries. For the auto industry, a median of 5.5 people were told of the experience and an estimated 36 percent of those told took action, meaning that for each customer delighted, 1.5 new customers may be generated. For e-commerce, 1.9 customers are produced for each customer delighted.
We recognize that the self-reported information on how many of those told acted on the referral is a weak metric. Across dozens of studies, the data is consistent and we agree that better metrics are needed. This is an area for experimentation, especially within online social communities where closer measurement and tracking of future purchases is possible.
Our analysis of the top-box (“definitely will repurchase”) intention to repurchase the product (for 10 product/industry categories) was 5-9 percent higher for delighted customers than for customers who were not delighted but still declared their experience the best in the last six months. This finding refutes the contention by Dixon, et al., that delighting customers produces no consistent payoff over reducing their effort and leaving them satisfied.
Delight can be delivered using digital channels.
One of the greatest surprises came from the question about the primary channel used for communication with the company. Forty-eight percent of delighted customers reported that they used digital channels – e-mail, chat or social media. Figure 5 shows the breakdown of channels for the primary delight experience.
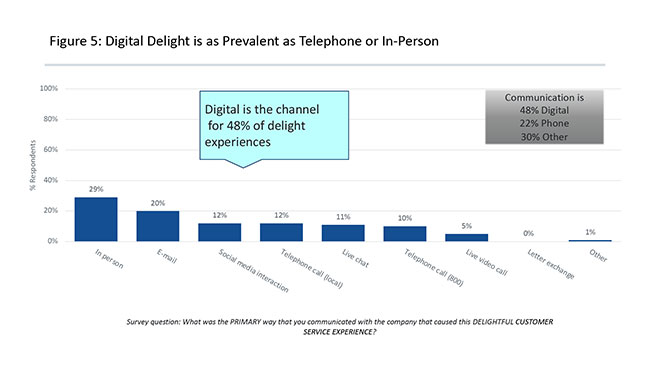
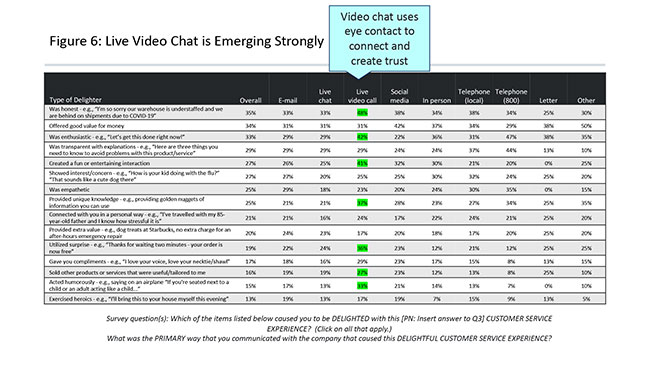
Figure 6, which reports channels used for all delight events (not just the most important), shows that every type of delight could be delivered by any of the channels. This is surprising because we did not expect that emotional messages such as enthusiasm and empathy could be delivered easily via digital channels. In fact, delight is almost as easily created by e-mail and chat as in-person or phone interactions. The results also did not vary much by age – also a surprise. In addition, we found that live video chat calls were one of the most-mentioned channels as a source of delight.
Implications for action in the service, marketing, CX and market research functions
There are five major implications of the CCMC/CLS/VIP delight study for marketing, CX, service and market research.
1. Marketing and CX must advocate for transparency and honesty in all sales and marketing messages. Such transparency not only fosters delight, it prevents many problems by setting proper customer expectations. For example, when a Southern insurance company’s welcome letter highlighted the limitation of the valuables covered by the homeowner’s policy, customers thanked the agent for pointing it out and asked to buy a rider to cover the additional valuables. Sales objected to the letter as focusing on a negative but the honesty actually generated additional revenue and avoided future problems.
2. CX and service should focus on training and empowering CSRs to deliver the eight humanistic experiences that cause delight – from empathy and enthusiasm to transparency, interest and concern. Further, supervisors must be directed to encourage delight and use monitoring and measurement tools to effectively evaluate its delivery across all channels.
3. CX and marketing must adapt delight techniques to digital channels. The fact that 48 percent of delight is delivered digitally now in an unsystematic manner means that much more can be delivered if a conscious effort is made and A/B experiments run to identify the most successful strategies.
4. Market research must work to more effectively categorize and measure delight and measure the impacts of WOM across all channels. Further, the impact of responses to social posting must be quantified. The best approach is to run experiments within a large social community.
5. Market research should translate the B2C delight research reported here to the B2B and employee arenas. CCMC has found that B2B customers reporting scores of 10 on a Net Promoter question behave similarly to consumers who have been delighted. Likewise, our research has shown that employee recommendations of the company as a great place to work are impacted by points of pain and frustrations in a manner like points of pain experienced by consumers.7 A study of the mechanisms and payoff for delighting employees would also be in order.
Research has been sparse
While complaints and satisfaction have been the subject of rigorous market research for decades, delight research has been sparse, especially across digital channels. This preliminary study by CCMC/CSL/VIPDesk suggests that there is as much income to be made at the high end of the CX spectrum as is being earned fixing the lowest end of the spectrum. We hope this study is the first of many in the field.
References
1 “Making service a potent marketing tool,” Business Week, June 11, 1984.
2 John Goodman and Marc Grainer, Increasing Customer Satisfaction, U.S. Office of Consumer Affairs, 1984.
3 Joseph Pine II and James H. Gilmore, “Experience Economy,” Harvard Business Review Press, 1999.
4 Matt Dixon, Karen Freeman and Nicholas Toman, “Stop trying to delight your customers!”, Harvard Business Review, July 2010.
5 Steven Curtin, “Delight Your Customers,” American Management Association, 2013.
6 Andrew Baker, Naveen Donthu and V. Kumar, “Investigating how word of mouth conversations about brands influence purchase and retransmission intentions,” Journal of Marketing Research, April 2016, p. 255.
7 John Goodman, Scott Broetzmann and Ted Nardin, “Fighting the Daily Grind,” Quirk’s, May-June, 2021.