Always room for improvement
Editor's note: Loren Chase is human dimensions program manager at the Arizona Game & Fish Department, Phoenix.
My first day living in Honduras I was meekly making my way to a seat on a bus crowded with people, produce and poultry. Without warning, the bus lurched forward, inadvertently sending me reeling, with my hands ending up in a very intimate location on a very surprised stranger. Both my unintended victim and I were mortified, and in my best high-school Spanish I murmured my rendition of “excuse me,” which promptly led to a slap on my face. I later learned that the “excuse me” I used (con permiso) translated to “with your permission” and was appropriate when passing by someone ... not when you are accidentally groping a stranger. The correct “excuse me” (que me disculpa) translated to “please forgive/pardon me,” which would have saved a bad situation from becoming the horrible set of circumstances that I am currently sharing to make my point.
Although not as extreme, researchers conducting cross-cultural research face similar dilemmas on a daily basis. Constructing survey items with uniform meaning across cultures is a perennial challenge for researchers and consequently articles regarding this issue are regularly discussed in the marketing research and sociology realms. Even different ethnicities within the same culture, speaking the same language, may interact with a survey item in various ways. Forward-and-back translating, cognitive testing and pretesting are simply no longer sufficient to ensure that we, as researchers, are making the best recommendations to decision makers.
Genuine variations
In conducting research across cultures, the challenge arises in discerning if differences between two groups are genuine variations between the populations or if they are artifacts of the measurement instrument. For example, different cultures may have cultural norms that may be exhibited as survey acquiescence, resulting in artificially higher ratings on a Likert scale. Other cultural norms may manifest as extreme response style; where using the ends of the scales will expand the variance of only one group. Another confounding issue is that different cultures may have different leniencies for scales, where one group may respond higher, not because they are more satisfied or agree more strongly with a statement but because their general expectation for evaluation is more lenient. Conversely, a group may respond lower because they have more stringent concepts of evaluation, again resulting in measurement invariance.1
Several solutions have been proposed to address cultural variance in survey measurement. One solution is to compare the ratings of different components of the survey against each other within the same cultural group. For example, let’s say we are measuring the entirety of a vacation experience of a hypothetical resort near the border of Costa Rica and Nicaragua. Nicaraguans may rank most aspects between a 7 and a 10 on a 10-point scale yet rate the food as a 5. Costa Ricans rank the same experience between 5 and 7 on the same 10-point scale, yet rate the food as a 2, indicating food is an area for improvement from both cultural perspectives. This method highlights relative strengths and weaknesses but precludes any direct comparisons between cultures.2 Another solution proposed to address cultural variance in survey measurement is normalization, a process discussed in an excellent Quirk’s article in 2004.3 This process involves comparing the respondent to all other respondents within the group and manipulating the responses to get a normalized score, usually with zero as the mean and measured in units of standard deviations. This approach may be useful but it obfuscates the original scale, which can be problematic when delivering information to those unfamiliar with Z-scores or other data transformations. Clearly, there is a need for a method to determine if various cultures interact with the instrument uniformly and allow analysts to thoroughly scrutinize the comparability while also allowing non-statisticians to understand the results.
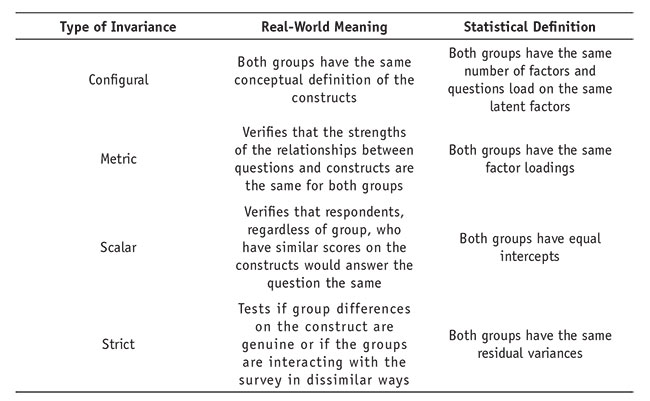
I propose that we, as research professionals, hold ourselves to a higher standard and begin taking advantage of multiple group confirmatory factor analysis (MGCFA). MGCFA is one of the most popular methods to test for measurement invariance across groups and functions by comparing progressively more restrictive models against less restrictive models, namely configural, metric, scalar and strict invariance (see chart).
Case study
Wildlife value orientations (WVO)4 give insight into how humans generally feel toward wildlife and acceptable treatment of wildlife. There are two main WVOs, utilitarian and mutualism. Individuals with a utilitarian orientation believe the needs of humans supersede the needs of wildlife and perceive wildlife as a resource to be managed for human benefit. As a result, they are more favorable toward hunting or lethal control. Individuals with a mutualism orientation believe wildlife are deserving of care, have rights similar to humans and view wildlife as potential companions capable of relationships of trust. As a result, they are less likely to support actions resulting in death or harm to wildlife. We measured WVOs using a 14-item (seven-point agree/disagree scale) battery designed to assess the two primary WVOs, utilitarian and mutualism.
We conducted an MGCFA to test for measurement invariance in WVOs between Hispanic and non-Hispanic whites. Because cultural heritage, including language(s), is the basis for the expectation that WVOs are different across ethnicities, we also tested for measurement invariance in WVO in acculturation and language. Unfortunately, both acculturation and language may also influence psychometric measurement.5 Two levels of acculturation were constructed using the middle of the acculturation scale to split Arizonan Hispanics of higher acculturation levels to those with lower levels of acculturation. The third MGCFA compared Arizonan Hispanics who responded to the survey in English to Hispanics who responded to the survey in Spanish, indicative of their preferred language.
Findings
There were 2,395 respondents in this research effort, with 883 self-identifying as non-Hispanic Whites and the remainder self-identifying as Hispanic. This oversampling of Hispanics allowed for a margin of error of ± 2.7 percent for Hispanics and ±3.2 percent for non-Hispanic whites (95 percent CI). There was a difference between the population and the sample in regard to education level (c2 (4, N = 2,053) = 89.34, p < .001, fc = .14; 86 percent of the population obtained at least a GED versus 91 percent in the sample; 61 percent of the population completed college versus 62 percent of the sample). Although the sample was slightly more educated than the population, the minimal practical significance did not justify weighting by this variable (Cohen, 1992).
WVO measurement across ethnicities
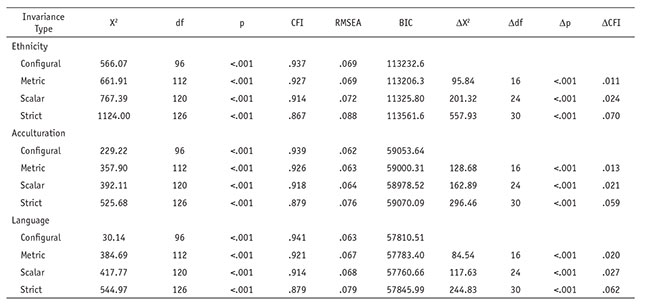
Non-Hispanic whites were more utilitarian than Hispanics ( χ̅ = 5.11 and χ̅ = 4.74; t (2151) = 7.06, p < .001, rpb = .17) but less mutualistic than their Hispanic counterparts ( χ̅ = 5.09 and χ̅ = 5.67; t (2258) = 10.56, p < .001, rpb = .19). Both Hispanics and non-Hispanic whites construe WVOs in similar ways (configural). Further, the strength of the relationship between WVOs and their respective survey items is similar between Hispanics and non-Hispanic whites (metric). Both ethnicities have similar rating standards (similar stringencies and leniencies) for WVOs (scalar). Similarly, both ethnicities have similarly residual variances (strict). These invariances support the hypothesis that the difference observed in WVOs between Hispanics and non-Hispanic whites is attributable to genuine differences in the means rather than divergent interactions with the survey instrument (Table 1).

WVO measurement across acculturation levels
Although we demonstrate a difference between ethnicities, Hispanic communities cannot be considered monolithic for a multitude of reasons, including acculturation. Less-acculturated Hispanics were more mutualistic ( χ̅ = 5.97 and χ̅ = 5.48; t (1219) = 7.70, p < .001, rpb = .19) and less dominionistic than their more acculturated counterparts ( χ̅ = 4.56 and χ̅ = 4.85; t (1215) = 4.46, p < .001, rpb = .12). Hispanics of high- and low-level acculturation psychologically configure WVOs in similar ways. Hispanics of both acculturation levels also assign the same relative strengths between survey items and the latent constructs. Both groups have the same stringencies and leniencies in ratings. In examining strict invariance, it appears WVOs can be compared in Hispanics of divergent acculturation levels (Table 3).
WVO measurement across languages
Hispanics who preferred using Spanish were more mutualistic ( χ̅ = 6.17 and χ̅ = 5.62; t (1189) = 6.39, p < .001, rpb = .15) but were similar to English-speaking Hispanics on the utilitarian scale ( χ̅ = 4.70 and χ̅ = 4.72; t (1184) = .33, p = .74, rpb = .02). English- and Spanish-speaking Hispanics configure WVOs comparably and assign similarly strong correlations between survey items and their respective WVOs. Hispanic respondents speaking either language had similar stringencies and leniencies in survey item ratings. The WVO construct is uniformly represented in both English-speaking and Spanish-speaking Hispanics, allowing for comparisons between the two groups.
Considerations
Research is in a constant state of fluctuation and the day that I conduct a research project and do not find a way to improve the investigation during the postmortem debriefing is the day that I will retire. There is always room for improvement but we recommend the following as a start when conducting cross-cultural research:
Use the right language. Gaining survey item equivalence across languages can be challenging, especially within Hispanic cultures that have varied countries of origin, each with its own vernacular, dialects and patois. This study is unique in that nearly 90 percent of Arizonan Hispanics claim Mexico as their country of origin.
When in doubt, use translations that are more formal. Several times in this study we debated which translation to use. For example, the term fauna was used for the term “wildlife” because of the familiarity with the term by Hispanics in the area. Fauna could have easily been replaced with a less-formal la vida salvaje or la vida silvestre, contingent upon the predominant ancestral country.
Use common scales. We used a seven-point Likert scale to tie into past research. We should have used a 0-10 scale because it is a more familiar rating system across cultures.
Use scales that transcend the mode of collection. This is becoming critical as multimode data collection is increasingly the norm. Furthermore, some cultures will respond differently to different modes of data collection and it may be more advantageous to use different modes, despite the fact that a singular mode may provide more consistency.
Make cognitive testing and pretesting iterative. Most researchers perform this once. When conducting cross-cultural research, plan more time to conduct this thoroughly.
Transform the data cautiously. Z-scoring the data, cross-country calibration or mathematically forcing equivalence is useful in many cases but the nuances and consequences may be lost on decision-makers.
Seek balance. Frequently, decision-makers need to have information that is globally applicable and speedily available. However, to obtain accurate data, the collection instruments need to be locally tailored, the data collection needs to be contemplated and then carefully analyzed. It is increasingly the role of the researcher to maintain this balance and is now part of the job description.
More culturally competent
Cross-cultural research will inevitably continue as information needs continue to span cultures and national borders. Although cross-cultural studies that do not discuss measurement invariance are informative, they may not be authoritative, as the scientific community cannot ascertain if the reported difference is attributable to true differences of the latent constructs or if they are artifacts of the measurement approach. Consequently, conducting measurement invariance analysis should be a necessary precondition when performing cross-cultural investigations that involve composite scales. By comparing and contrasting how additional cultures interact with survey assessments, researchers can be more culturally competent and inclusive in decision-making processes.
References
1 Garcia, C. (2013). “Tipping the (survey) scales: How to set the multicultural record straight.” Quirk’s Marketing Research Media. http://researchindustryvoices.com/2013/01/29/tipping-the-survey-scales-how-to-set-the-multicultural-record-straight/
2 Cape, P (2014). “When 8.5 is less than 6.2: Understanding the challenges of cross-cultural scaling.” Quirk’s Marketing Research Review. Vol. 28. No. 11. November 2014. pp. 44-47.
3 Devlin, S. and Nicholas, G. (2004). “Avoiding pitfalls of country comparisons.” Quirk’s Marketing Research Review. Vol. 18. No. 9. November 2004. pp. 42-49.
4 Chase, L. (2016). “Measurement of wildlife value orientations among diverse audiences: A multi-group confirmatory factor analysis among Hispanic and Non-Hispanic white communities.” Human Dimensions of Wildlife, 21(2), 127-143.
5 Sperber, A.D., Devellis, R.F., Boehlecke, B. (1994) “Cross-cultural translation: methodology and validation.” Journal of Cross-Cultural Psychology 25,501-524.