
Editor's note: Keith Chrzan is SVP analytics at Sawtooth Software. He can be reached at keith@sawtoothsoftware.com.
Customer experience (CX) research seeks to answer two important questions: How are we performing? How can we best improve performance? Answering the first question involves having respondents provide some overall evaluation of their experience like customer satisfaction (Westbrook 1980) or advocacy (Reichheld 2003). While both measures (and others) have their proponents, no one doubts the need for some sort of report card for the overall rating of the product or service.
As a way of answering the second question, importance ratings may come to mind. Widely used in the marketing research industry, importance ratings are easy to ask and answer and they require very little questionnaire real estate – for example, in one study respondents rated the importance of 10 items in only 38 seconds – so just under 4 seconds per attribute rated (Chrzan and Golovashkina 2006). Unfortunately, importance ratings perform poorly in terms of their validity. Even more unfortunately, many marketing researchers remain unaware of just how bad importance ratings are. I find this surprising, because a trio of papers published 40 years ago in the industry’s premier academic journal, the Journal of Marketing Research, found that importance ratings not only have no predictive validity, they in fact have negative predictive validity when used to model preferences (Bass and Wilkie 1973; Beckwith and Lehmann 1973; Wilkie and Pessemier 1973). To bring this to marketing researchers’ attention, Chrzan and Golovashkina (2006) replicated the earlier finding, again reporting that using importance ratings to weight attributes reduces the predictive validity of the resulting preference models.
To be fair, the CX industry largely moved away from asking stated importances a long time ago. Finding that they could be even more efficient with questionnaire real estate by doing away with respondent-provided importance measures entirely, CX researchers began deriving importances statistically instead. One derives importances by regressing attribute performance scores on the overall evaluation of customer experience (i.e., on satisfaction, intent to return, advocacy or an index of the three) and then using the regression coefficients as measures of importance. Unfortunately, deriving importance turned out not to be a panacea. Customer satisfaction ratings contain very strong halo effects (Thorndyke 1920).
A halo effect occurs when all of the attribute ratings are highly correlated with the overall rating and with each other: that is, in Thorndyke’s memorable description, their correlations are “too high and too even.” This pervasive psychological effect on the way people answer survey rating scale questions creates havoc with derived importances: whereas regression analysis requires that the predictor variables (the attributes) to be uncorrelated if they are to produce unbiased measures of importance, the halo effect violates this requirement. Worse still, Dawes and Corrigan (1974) and many others have found that uniform (equal) weights for all the attributes, or even random weights, often have more predictive validity than the importance weights that come out of a regression analysis. This is the final nail in the coffin of derived importance modeling.
In summary, we cannot rely on either importance ratings or on derived importance to help us prioritize attributes for improving customer experience. CX researchers need a better way to answer the second question above: How can we best identify the attributes to leverage to improve the customer experience?
I recommend PIE as that better way.
In a performance improvement experiment (PIE), we show a given respondent different subsets of attributes that might be improved and ask her which attribute, if improved, would most elevate her satisfaction with the product or service.
Take for instance Karl’s Suites, a hotel chain serving business travelers. The first question in a PIE exercise for Karl’s might be:
Which of the following, if noticeably improved, would most have made your stay at Karl’s Suites better?
□ Smoother reservation process
□ Easier to redeem rewards
□ Cleaner bathtub
□ Better lighting in the parking lot
□ Less outside noise audible in the room
□ None of these would have made my stay at Karl’s Suites any better at all
The next question might be:
Which of the following, if noticeably improved, would most have made your stay at Karl’s Suites better?
□ Cleaner-feeling bedroom
□ Better selection of foods at breakfast
□ Better quality of food at breakfast
□ More water pressure in the shower
□ A white-noise machine on the nightstand to help me sleep
□ None of these would have made my stay at Karl’s Suites any better at all
And so on for 10 or 15 or so such questions.
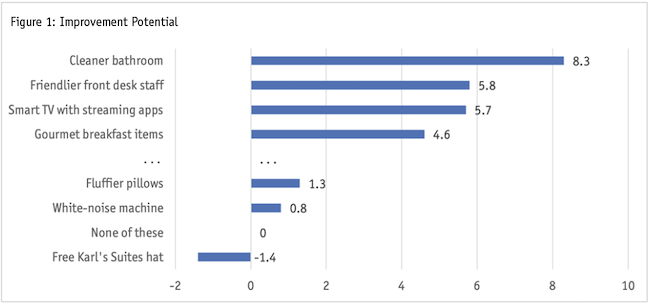
PIEs leverage the findings of Thurstone (1927), who showed that respondents can relate their preferences accurately if we ask them to make repeated choices among experimentally designed stimuli. Thurstone’s work became known as the method of paired comparisons. PIE uses a multiple-choice extension of the method of paired comparisons. In fact, you can think of PIE as a type of best-worst scaling (or MaxDiff) question where we only ask for the best response. As such, you won’t be surprised that what results from a PIE is a set of utilities or importances like you would get in a MaxDiff study (Figure 1).
One difference that separates PIE from MaxDiff is that we include a constant “none of these would have made my stay at Karl’s Suites any better at all.” This creates a utility threshold that separates attributes that matter to respondents (those above the “None of these”) from those that don’t move the needle at all (like “Free Karl’s Suites hat” in the example in Figure 1). Typically, we scale the threshold to be the origin, or zero point, in the importance scale, so that the attributes capable of improving the customer experience have positive values and those unable to improve customer experience end up with negative utilities. Clearly this threshold aids in the interpretation of results.
Because of previous work done on the capabilities of MaxDiff, we know a lot about how to design performance improvement experiments and about asking and analyzing PIE questions.
First and most importantly, we know that MaxDiff does an excellent job of measuring attribute importance: Chrzan and Golovashkina (2006) found that MaxDiff outperformed five other methods for stated importance measures, two kinds of importance ratings among them, in terms of discriminant and predictive validity.
We also know that MaxDiff questions work better when they contain four or five attributes than when they contain more or fewer.
In addition, if we ask enough PIE questions so that each respondent sees each item at least three times, we can get good respondent-level estimates of attribute importance. For example, with 12 attributes, we can show them three times each by asking each respondent nine PIE questions, each containing four attributes plus the “none” threshold item. Respondents may get fatigued by repeatedly answering similar-looking PIE questions, so we don’t usually recommend striving for respondent-level results with more than about 25 attributes (that is, about 15 questions of five attributes and a “none” each).
The original version of MaxDiff was made to work with individual-level analysis like this and PIE shares this extreme scalability: We can get good importance measures for individual respondents, entire populations or any subgroups of interest. That means that CX researchers can slice and dice the PIE importance results in any way required by their research objectives, without having to keep going back to rerun the model with subsets of respondents (as they would have to do if they derived importances via regression).
Moreover, we know from research on “sparse” MaxDiff designs that even if we don’t show each attribute at least three times per respondent we can still get good sample-level or subgroup-level utilities by asking enough questions so that each respondent sees each attribute at least once (Chrzan and Peitz 2019). This means we could handle a PIE with 100 attributes by asking 20 questions each with five attributes and the “none.” CX research doesn’t usually require respondent-level importances, so we recommend this sparse-design strategy instead of requiring each item to appear three times per respondent, at least when we have more than 20 or so attributes.
Other MaxDiff design technologies (something called Express MaxDiff) may even produce good sample and subgroup-level utility estimates when respondents see attributes less than one time, on average, and, like the “sparse” design strategy in MaxDiff, these can be applied to PIE as well.
Of course, PIE does require some investment in questionnaire real estate: the PIE questions take respondents a bit longer to answer than do stated importance ratings (MaxDiff questions take about four times as long as importance ratings but PIE are simpler and should not take quite that long). CX researchers who want to know how to move the needle, however, should find this a small price to pay to get attribute prioritization they cannot get from importance ratings or from derived importances.
Sensitive and discriminating
CX researchers can avoid the serious problems that plague both stated importance ratings and derived importance analysis by using a performance improvement experiment. PIE involves experimentally designed questions which, upon analysis, produce extremely sensitive and discriminating measures of the attributes most able to improve the customer experience – the single most valuable goal of CX research. As a special case of MaxDiff, PIE shares many of the strengths of MaxDiff, namely its robustness and scalability, its flexibility, its familiarity to researchers and its implementation via readily available software.
References
Bass, F.M. and Wilkie, W.L. (1973) “A comparative analysis of attitudinal predictions of brand preference.” Journal of Marketing Research, 10, 262–269.
Beckwith, N.E. and Lehmann, D. (1973) “The importance of differential weights in multi-attribute models of consumer attitude.” Journal of Marketing Research, 10, 141–145.
Chrzan, K. and N. Golovashkina (2006) “An empirical test of six stated importance measures.” International Journal of Market Research, 48(6), 717-740.
Chrzan, K. and M. Peitz (2019) “Best-worst scaling with many items.” Journal of Choice Modeling, 30: 61-72.
Dawes, R.M. and B. Corrigan (1974) “Linear models in decision making.” Psychological Bulletin, 81: 95-106.
Reichheld, F.F. (2003) “The one number you need to grow.” Harvard Business Review, 81, 46-55.
Thorndike, E. (1920) “A constant error in psychological ratings.” Journal of Applied Psychology, 4: 25-29. http://dx.doi.org/10.1037/h0071663
Thurstone, L.L. (1927) “A law of comparative judgment.” Psychological Review, 34(4), 273–286.
Westbrook, R.A. (1980) “A rating scale for measuring product/service satisfaction.” Journal of Marketing 44(4), 68-72.
Wilkie, W.L. and Pessemier, E.A. (1973) “Issues in marketing’s use of multi-attribute attitude models.” Journal of Marketing Research, 10, 428–441.