Editor's note: Michael Lieberman is founder and president of Multivariate Solutions, a New York consulting firm. He can be reached at michael@mvsolution.com.
Dutch economist Peter Van Westendorp developed a price model known as the Van Westendorp price sensitivity meter. I am sure that many marketing research professionals have used it at least once in their career.
The price sensitivity meter asks four survey questions:
- At what price would you think this product is a good value?
- At what price would you think the product is getting expensive?
- At what price is the product so inexpensive you doubt its quality?
- What price would you think is too expensive for you to consider buying the product?
When using the meter, researchers can determine the following price definitions:
- Point of marginal cheapness (PMC)
- Price point where more sales would be lost due to questionable quality than would be gained from bargain hunters.
- Point of marginal expensiveness (PME)
- Price point above which cost is a serious concern, where it is felt that the product is too expensive for the value derived from it.
- Optimum price point (OPP)
- At this price point, the percentage of customers that feel the product is too expensive is the same as those who feel it is so low that the quality is questionable.
- Indifference price point (IPP)
- Point at which the same percentage of customers feel that the product is getting too expensive as those who feel it is at a bargain price. This is the point at which most customers are indifferent to the price.
- Range of acceptable pricing (RAI)
- The difference between the point of marginal cheapness and the point of marginal expansion.
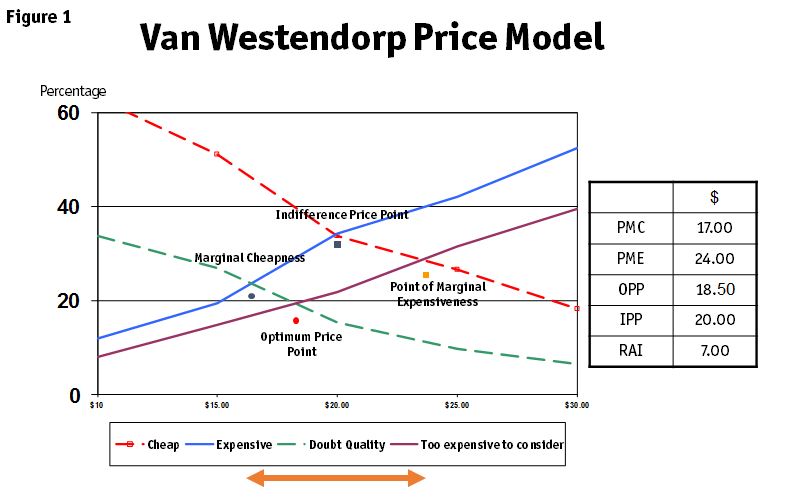
Figure 1 shows a typical output:

Based on the model, the client should price the item between $17 and $24, with the Van Westendorp optimal price point at $18.50.
A useful extension of the Van Westendorp adds the following:
- At what price would you think this product is a good value?
- How likely are you to purchase the product at this price?
- At what price would you think the price for the product is getting expensive?
- How likely are you to purchase the product at this price?
The purchase intent results gathered from the two additional questions can be used to calculate penetration of the product at important price points (by dividing the number of people who expressed interest at each level by the sample size). We can then calculate the revenue per every 100 customers by multiplying the price by penetration by 100.
The revenue forecast extension chart is shown in Figure 2, with an overlay of the Van Westendorp price sensitivity meter price points.
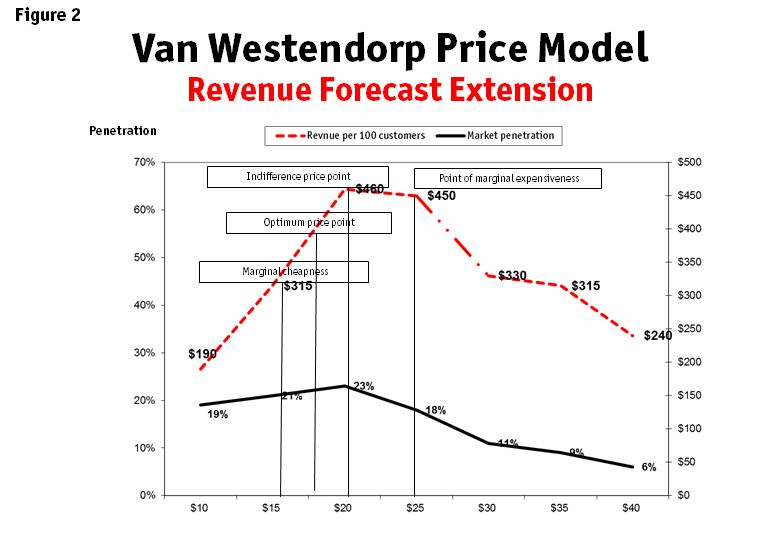
Years of using the Van Westendorp and the revenue extension have taught me a lesson: The point of marginal expansion – rather than the optimal price point – is the price to be recommended to the client. Demand for the product almost always drops off at the point of marginal expansion. This is where the tested item should be priced.
A partial Van Westendorp involves applying two of the questions to arrive at a perceived price. This method is particularly useful when placed within a larger survey or if multiple items are to be tested.
I will illustrate the point with Edible City, a fictional, mid-size organic food chain based in New Orleans. Edible City is conducting a lengthy brand survey to assess its local equity. The company also wants to test the price of its new microbrew house beer, Red House, and its premium version, Red House Premium.
The original version of the Edible City survey asked respondents, “How much would you be willing to pay for a six-pack of our special branded microbrew, Red House? How much would you pay for a six-pack of Red House Premium?”
I suggested that we use half the Van Westendorp. The Van Westendorp questions can leave answers open-ended or suggest a discrete range of prices. In my view, Red House would do best with a suggested range of prices. The Edible City execs would like to price a six-pack of Red House at $5.99 and Red House Premium slightly higher.
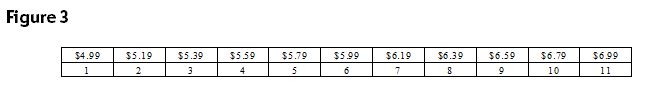
In order to produce a useful price range, I used the $5.99 as a starting point. I inserted it in the middle of the array and then produced five price points at either end in $0.20 intervals.
Figure 3 depicts the price array that was produced and shown to respondents:
It was imperative in this study that respondents were asked to price Red House before Red House Premium. Why? One would expect Red House to be less expensive than Red House Premium. If the latter were presented first, it is likely that results for both Red House and Red House Premium would be skewed lower than intended. This is referred to as the problem of anchoring.
Respondents were first given a description of Red House, Edible City’s new microbrew. They were then asked:
- Given what you heard about Red House, at what price would say you a six-pack is a good value?
- At what price would you say a six-pack of Red House is getting expensive?
The questions were then repeated for Red House Premium.
Visualizing the comparative results
A traditional Van Westendorp maps the four distributions. Given that we also asked four pricing questions, we are able to visualize them in one chart, shown in Figure 4.
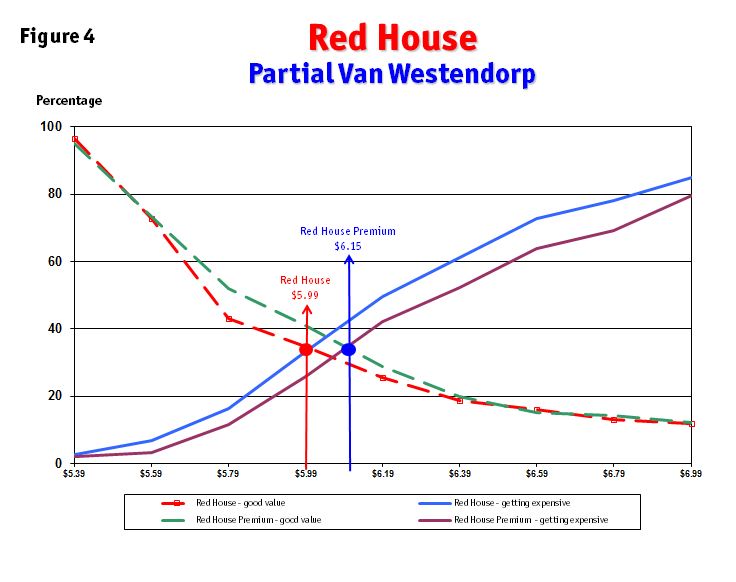
It seems that Edible City was correct in assessing a $5.99 price tag for Red House. The company can price Red House Premium about $0.20 higher.
The partial Van Westendorp is a multipurpose and creative approach to pricing. Moreover, it fits into the multi-product studies routinely fielded by pharma and big food. Companies can also use this pricing approach for new products.
Marketing researchers are becoming consultants to clients on key findings and strategies for moving forward. Though do-it-yourself platforms are on the rise, it does not indicate the death of expertise. In fact, the opposite is true. Flexible approaches to known methods like the Van Westendorp – which adds versatility and value to crowded, multi-product surveys – are filling a crucial knowledge gap.