
SPONSORED CONTENT
 By Susan Johnston, GM and SVP, Business Development, Informed Decisions Group Inc.
Informed Decisions Group Inc. (IDG) is a full-service behavioral insights firm focusing on shopper insights and consumer science. We specialize in measuring the impact of changes in branding, communications, design, assortment and organization on shopper behavior.
 By leveraging eye-tracking with other behavioral methods, our shopper research has innovated areas from package design to planogram (POG) optimization and in-store communications. Recognized as a top company for in-store research by Quirk’s in 2020, we also rely on our proprietary virtual aisle technology when in-store approaches are not feasible. Our flagship offerings include:
- Mobile and stationary eye-tracking
- Biometrics including micro-expression coding and galvanic skin response
- Retail ethnography
- Customer intercepts
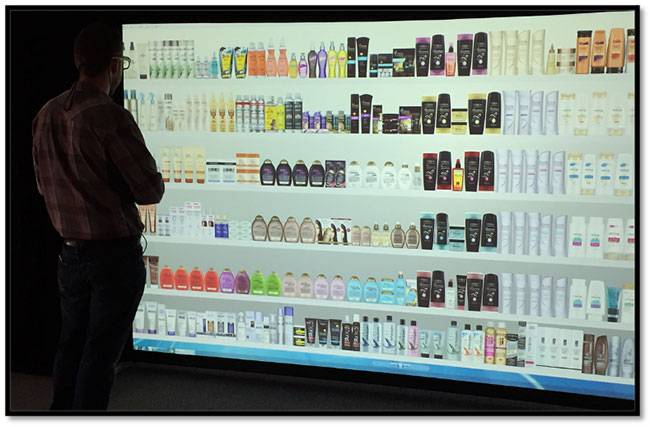
- In-person life-sized and online virtual aisles
- Market segmentation and targeting
- Conjoint and market simulation modeling
Being among the first market research companies that began leveraging mobile eye-tracking (MET) for shopper research, our behavioral science team has developed ways of analyzing and interpreting gaze data that differs from traditional procedures. This enables clients to gain a better understanding of how visual changes impact shopper behavior at the shelf.
MET has come a long way since the cumbersome glasses, hats and backpacks that required a long calibration process. Additionally, the software available in MET’s infancy made analyzing a large number of products on the shelf nearly impossible. Throughout the years of executing MET projects and addressing the innovative needs of clients, IDG has focused on developing analytical procedures to confidently generate insights for entire shelves to entire retailers.
 One procedural advancement with mapping and analyzing MET data from shopper research is to code for every product on the shelf, giving the client a real-life expectation of their new planogram or package’s performance. A common practice has been to map data just for the package being tested or a specific brand’s SKUs in a new POG. But this assumes a unidimensional approach which assumes a change to the shelf only impacts shopper behavior for one product or specific products being tested, when in fact any change to a shelf can impact shopper behavior for many products.
Taking from the idea to include every product on the shelf for mapping and analysis, the following three metrics have proven to be crucial in best understanding how changes impact an entire shelf.
- Share of engagement – The primary metric to use when examining an area of interest’s performance.
° This considers the total engagement, in seconds, attracted by all products on the shelf, similar to a market share metric. The higher the share, the more attention the SKU is attracting from other SKUs on the shelf.
- Percent noticed – Measure of initial “breakthrough”
° This shows the average percent of shoppers who noticed each SKU on the shelf. While some SKUs may have a strong breakthrough, they can still have low share of attention due to shoppers not being engaged with the SKU.
- Engagement – Shows the ability of a SKU to retain attention once attracted.
° This measures on average, in seconds, how much time each SKU was able to attract from the shoppers.
° The longer a shopper looks at a SKU, the higher the probability of them buying it. Generating one additional second of engagement can increase odds of purchase from 43% to 550%, depending on the brand. (Espin and Valdiserri, Quirk’s Marketing Research Review, December 2013).
Further advances in the use of eye-tracking data have led to segmentation analysis of gaze data to generate shopper segments based on how they shop a shelf. The more obvious types of eye-tracking-based segmentation include the aforementioned fixation metrics but time-to-first-fixation can also be used to generate segment-specific scan paths to better understand how subgroups of shoppers navigate the shelf.
Case study POG optimization
When a new client decided they wanted to optimize their product placement to help their brand as well as increase sales for the overall category, they partnered with a national retailer to test varying aisle orchestrations virtually and forecast sales to narrow down the final organizations to be tested using a mock in-store setting at a retail lab.
All of the forecasts showed an increase in sales for the client’s brand given the finalized product placement. For the final test and confirmation, they partnered with a retail lab and IDG for mobile eye-tracking to completely understand how this new POG would affect shoppers’ behavior. While pre-recruited participants shopped, their visual attention was quantitatively measured in the aisle.
The eye-tracking data confirmed that the new POG did, in fact, attract more attention to the client’s SKUs, which would yield increased sales. IDG also measured the competitor brands and found that while this new POG would increase sales for the client brand, it was also attracting even more attention for two of their primary competitors. So, while the client would experience a lift in sales, they would experience a decrease in share due to their competition experiencing a bigger lift in sales. Where other eye-tracking results would have claimed the new POG a winner, they would have inadvertently misdirected their client into a scenario of decreased share. IDG’s Share of Attention feature caught this before being it was implemented and was able to create a better POG optimization.
As eye-tracking technology and analysis have significantly advanced over the past decade, the immediate future of in-store applications appears to be hindered due to retailer permissions from COVID-19 reactions and restrictions. While this can present a challenge to shopper research especially with regards to in-context eye-tracking, innovations exist (and will most likely advance quickly) that can allow eye-tracking in real-world environments.
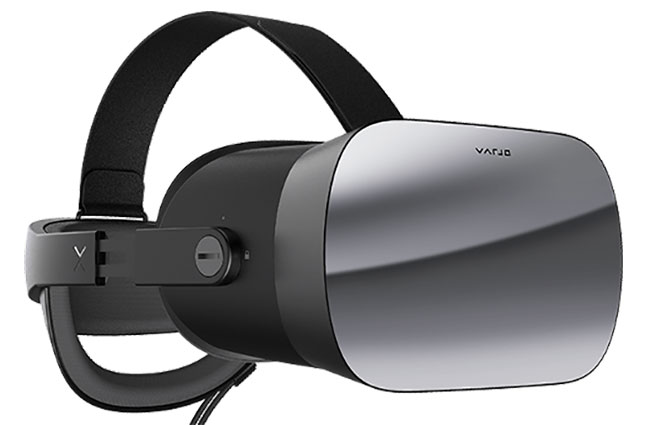
Virtual methodologies including VR headsets and life-sized virtual aisles enable clients to continue with in-context shopper research for behavioral insights at the shelf. Both options incorporate eye-tracking and can replicate the in-store experience with surprising realism. Beyond eye-tracking, these virtual methodologies allow the collection of basket metrics and provide seamless integration of retail ethnography, post-shop surveys and qualitative shop-alongs. More advanced experimental designs can incorporate volumetric conjoint analysis and simulation/forecast modeling.