
Editor’s note: Juraj Kavecansky is senior director, marketing sciences in data science, at research firm InMoment, South Jordan, Utah.
 The benefits of improving customer experience can be measured by the extent to which positive customer experiences lead to better business results. Better intelligence and insight into your customers (and their behaviors) leads to experience improvements and greater ROI.
Business is changing rapidly, but many companies are still running dated experience programs. In addition, many are trying to solve problems that can’t be solved by technology alone. True innovation often requires leveraging data science and industry experts who use a variety of models and methods to derive intelligence from and make more connections with your program data so you can improve every experience – not just manage them.
Bridging the gap between customer feedback and behavior
Linkage analysis can help establish a business case for managing and improving your customers’ experiences by moving beyond just surveys to prove the value of your technology and CX investments. It is one way to bridge the gap between customer feedback and behavior. A linkage analysis initiative can give you the added intelligence you need to align your people, processes and activities so that your organization can increase its ability to make customer-based business decisions and uncover areas of growth, retention, friction and cost savings.
There are misconceptions about linkage analysis and its use. Many brands that haven’t tried linkage analysis think it is too complex, takes too long to complete or requires too many resources. Other brands that attempt linkage analysis accrue disappointing or inconclusive results.
Investigative power
So, what does it take to perform linkage analysis effectively? Let’s start with the basics of linkage analysis and how it can help your brand. Linkage analysis provides a way to explore and quantify relationships between customer experience and business results. Linkage analysis is the process by which information from different sources is brought together for the purpose of discovering relationships among data. It gives companies the ability to pinpoint the financial implications of CX programs, including how improving key metrics impacts the bottom line. It also examines how improving operational metrics improves the customer experience.
Let’s take a look at a few ways companies can use linkage analysis to identify potential revenue growth initiatives within their businesses.
As an example, a quick-service food chain analyzed its overall satisfaction with the company score for frequent guests (more than eight visits per month) and infrequent visitors (once per month), and found that satisfaction scores dropped over 25 points for infrequent visitors. Running a linkage analysis for the company identified $13 million in potential revenue across 550 locations. This added revenue could be attained by improving the experience for infrequent guests and getting them in the door just one more time each year.
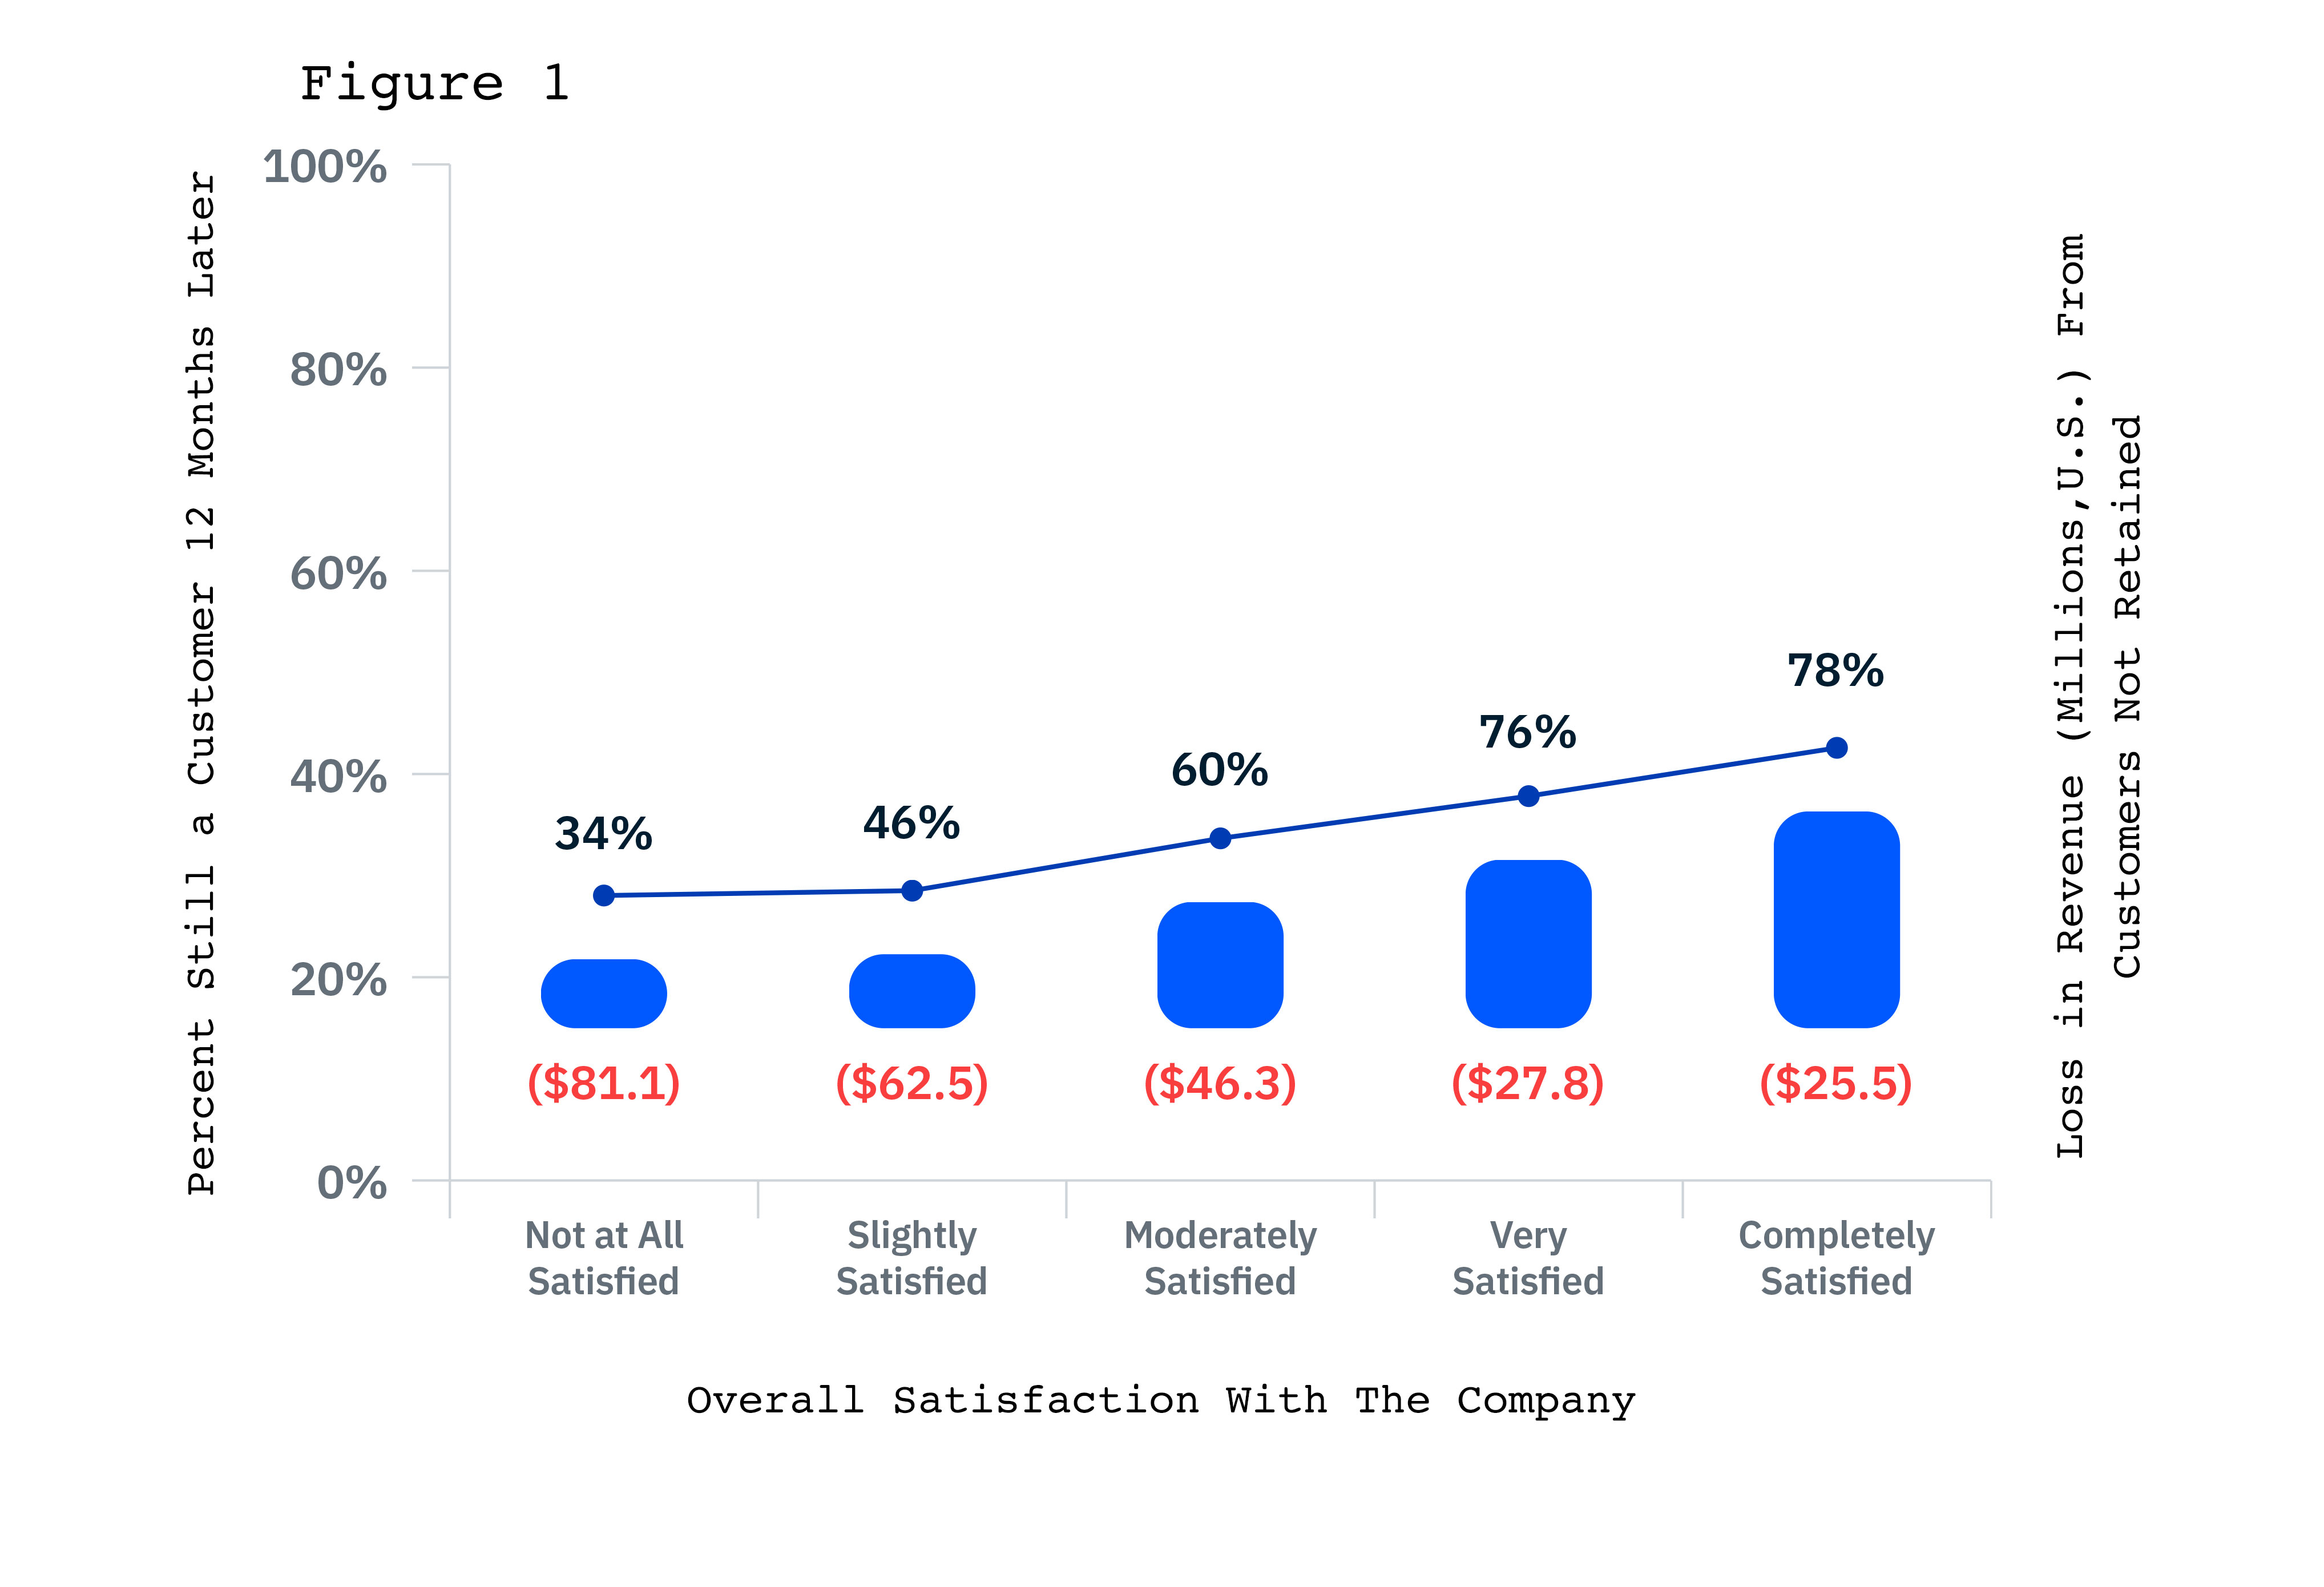
In a second example, a lawn care company conducted a linkage analysis to determine the relationship between its customer satisfaction and customer retention. The study found that 34% of customers who were not satisfied with their service remained their customers one year later, while 78% remained customers if they were completely satisfied. The loss of customers resulted in a significant loss in revenue (Figure 1).
 In a third example, a linkage analysis was conducted to determine the relationship between satisfaction with a car dealership and dealership loyalty. The team saw that a clear pattern exists between the car dealership satisfaction and future car repurchases (Figure 2).
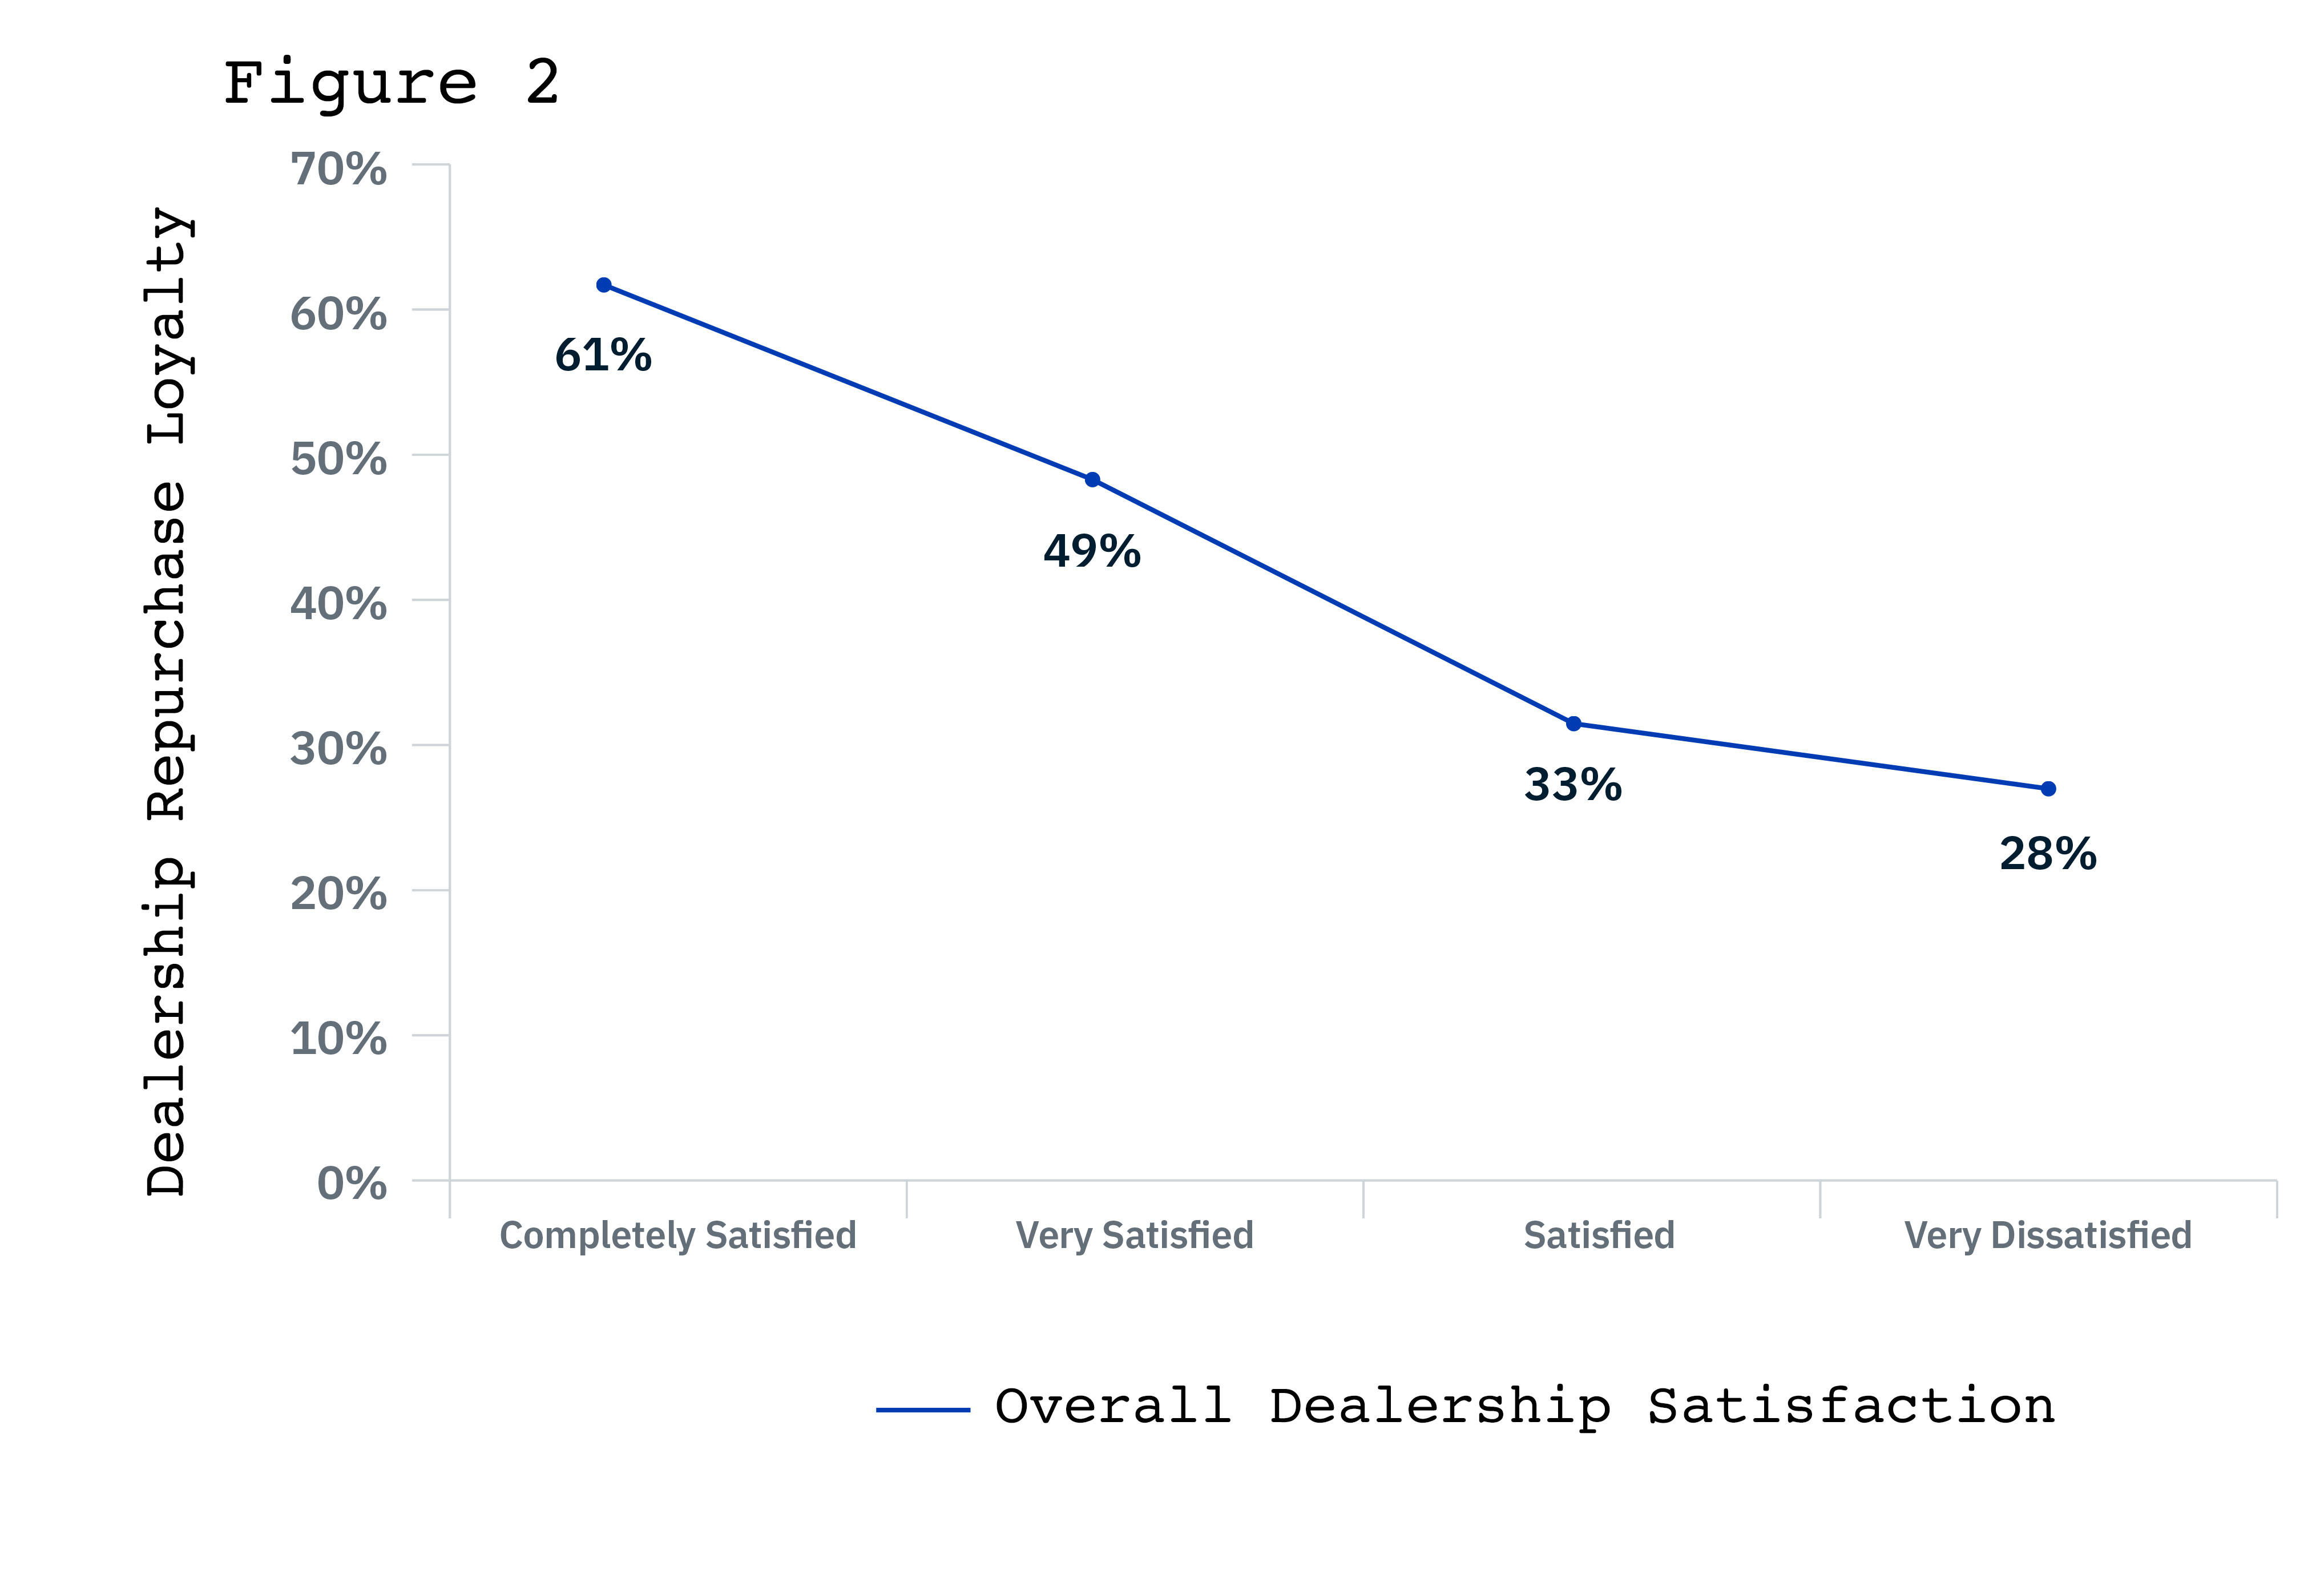
Industry statistics (average annual new vehicle sales and average price of a new vehicle) were then used to model the average return vehicle sales and additional revenue for a typical U.S. dealership given the level of customer experience they provide. In 2021, this analysis showed that if an average dealership can raise each customer’s satisfaction level by one point on a four-point scale, loyalty-related return sales would add about $2.4 million to its revenue. If dealerships let every customer’s satisfaction level fall by one point on a four-point scale, there is approximately a $3.5 million loss in loyalty-related sales revenue.
Moving all customers up or down one level of satisfaction is a large change, so models were also run to see what happens when a dealership’s overall customer experience score (on a typical 100-point scale) changes. The study found that each point on the 100-point scale accounts for approximately $147,000 in loyalty related revenue.
Three keys to a successful linkage analysis strategy
The more you know, the better your customers’ experiences will be. One of the benefits of using linkage analysis as part of your CX strategy is the ability to dive deep into the most pressing questions you want to answer. These questions range from overall business questions to specific customer questions to exploring financial “what if” scenarios that can help you further understand your customers’ relationships with you.
1. Review overall business insights.
Understanding top-level loyalty, retention and business profitability are key to building customer relationships and tying them to overarching business drivers.
- How is customer experience related to customer loyalty?
- How do changes in operations under my control affect customer retention?
- How does customer satisfaction relate to profitability?
- What are the financial impacts of improving our customer experiences?
2. Be customer-specific.
Drilling down into the detail of customer-specific transactions and behaviors can answer many questions.
- Which is more critical to customer retention: how call center representatives handle customers’ problems or the mechanics of the contact (navigating the menu, wait time, how the customer is greeted, etc.)?
- What aspects of a new car buyer’s experience with the sales process and in-warranty dealer service are most influential in repurchasing the brand when the customer is in the market again?
- How good do service levels have to be to achieve/maintain a desired market position, and at what level do we gain little or nothing by improving them?
3. Explore “what if” scenarios.
When linkage analysis results are integrated into simulation tools, organizations are free to explore such financial scenarios as:
- The revenue upside for shortening the claims handling process.
- The incremental annual revenue an auto dealer gains (or loses) in sales and service revenue by increasing/decreasing satisfaction.
- The value of an engaged workforce in lowering absenteeism and reducing turnover.
Leveraging more data
Leveraging data types throughout the company is key to ensuring your linkage analysis initiative will be successful. The more types of customer data you can make available to cross reference, the more insight your team will have to make business decisions. The chart below shares a few examples of the recommended types of data to include in linkage analyses.
Data Type | Examples of Data to Include |
Survey data | • Satisfaction • Loyalty • Intent to repurchase |
Operational data | • Operational standards • Metrics e.g., cleanliness, organization • Service level metrics, e.g., wait time, problem resolution |
Customer data | • Segments • Tenure • Customer spend • Demographics • Account status and history |
Employee data | • Tenure • Experience • Education • Demographics |
Financial data | • Revenue • Account information • Firmographics |
Managing linkage analysis
Many brands feel linkage analysis is too complex, too time consuming or that they do not have the right resources to utilize it. Below are five key steps to effectively managing linkage analysis.
1. Discussion of scope and process: Determine the scope of the linkage analysis and all available data. This discussion should include all stages of the process, including expectations and limitations. You should then develop a blueprint of the business model to determine which business outcome to track and all the variables that might influence the outcome. Sufficient planning and communication are essential to achieving a successful outcome.
2. Data preparation: After the scope has been defined, you should conduct a data inventory and identify what intelligence is available. Once this data has been delivered, it can then be merged with survey data and prepared for analysis. Data preparation techniques often include variable transformations, aggregation, categorization, missing value imputation and variable type correction.
3. Exploratory data analysis: In this step, intelligence is collected from the data based on descriptive statistics (e.g., means, frequencies, standard deviations). You can use these statistics to determine whether any significant patterns exist in the data, which helps to identify the variables that will be included in the model.
4. Modeling: You can use the data you’ve gathered to build a formal statistical model that links the customer experience data, operational data, business metrics, etc., as defined in the scope stage. Useful techniques include linear regression analysis, partial least squares, decision tree techniques and true driver.
5. Simulator: Uncover statistical relationships between the data to enable various “what if” financial scenarios in which the user can explore expected impacts on business metrics or customer behavior. Since the model is based on actual data, this impact reflects the actual relationships and can be used to identify improvement opportunities.