Transcending brand and loyalty
Editor's note: Danica R. Allen is global director customer satisfaction and experience at GfK Custom Research North America, New York.
This is the second of a two-part article describing a new system for consumer experience measurement capable of subsuming both brand and loyalty research. Last month, we introduced the basic building blocks of this system. This involved a common currency and a common language that facilitate spanning the chasm between brand and loyalty. The common language involves experience touchpoints (XPs), which may include indirect brand exposures such as a friend’s recommendation or direct interaction such as usage or ownership.
The system’s common currency has its roots in evolutionary psychology and mind modularity. In effect, this approach advances the idea that, in a Darwinian fashion, the human mind has developed five separate and distinct modules to process its environment: cognitive; social; sensorial; emotional; behavioral.
According to evolutionary psychologists like Pinker (1997) and Plotkin (1998), each module has adapted to the unique aspects of one of five environmental elements. This modularity facilitates our day-to-day journey through life and helps us process our complex environment. That each module has evolved to process a unique dimension in parallel makes our lives easier and perhaps has even ensured the survival of our species. There is a very real likelihood, for example, that the behavioral module is more closely linked to the autonomous nervous system. It makes sense that in a life-threatening situation the behavioral module would engage first and invoke a fight-or-flight response.
The system described in this article interleaves the evolutionary psychologists’ mind modularity concept with the work of Pine and Gilmore (1997). The latter focused on the emergence of an experience economy. Of particular interest was the notion of memorability as a critical nature of the economic offering. We embraced this concept and as will be described later, determined that it represents a critical aspect of the consumer experience.
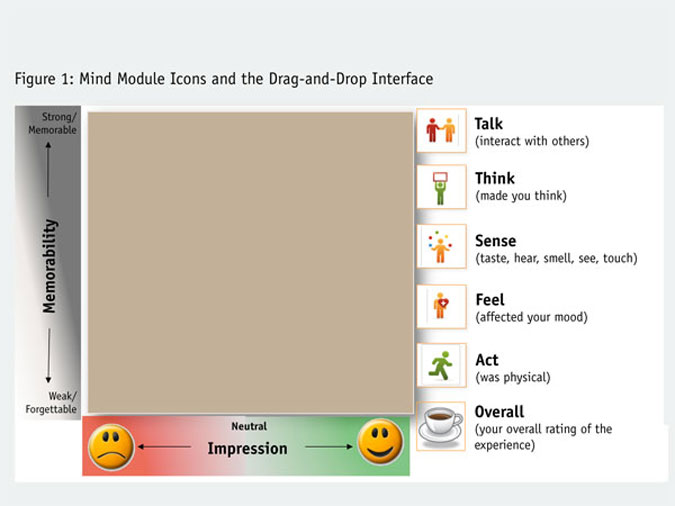
As described in part one of this article, the five modules were translated into consumer-friendly terms and enhanced with graphic icons (Figure 1). Respondents then used the drag-and-drop interface to rate a particular experience point (XP) in terms of the memorability and impression (valence) of each dimension. Finally, a sixth icon representing the overall experience point was also moved into the quadrant space. Prior to engaging in this task, respondents were extensively socialized with the dimensions and quadrant axes.

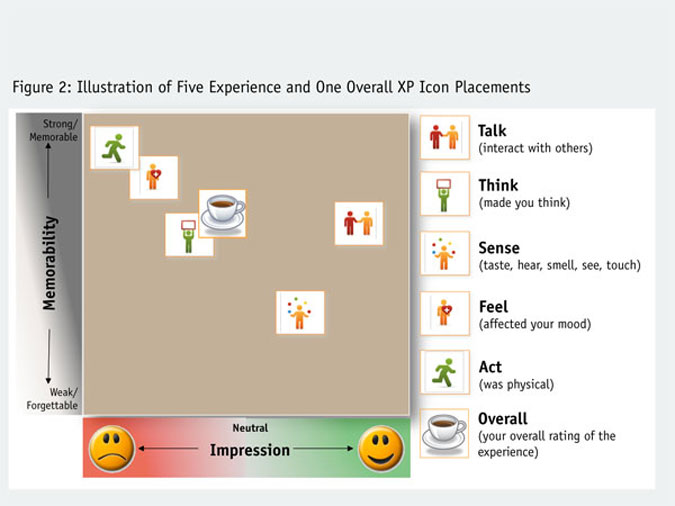
Figure 2 illustrates the result of one hypothetical respondent’s placement of the five experience icons and an overall (coffee drinking) experience point. By dragging and dropping the five mind module icons and single overall experience icon into the two-dimensional space, respondents created 12 unique scores. That is, each icon was associated with an x-axis score and a y-axis score. The resultant data, as described in part one of this article, yielded psychometric properties that were more desirable than traditional Likert scales. A parallel study demonstrated that Likert scales produced heavily left-skewed distributions with respect to the five dimensions and a wide variety of traditional brand and loyalty KPIs.
The x- and y-axes of the quadrant represent the critical dimensions upon which each mind module icon is evaluated. The horizontal axis represents impression or valence. Its endpoints range essentially from bad to good though these verbal anchors do not appear on the scale. The range is reinforced with color (red to green) and the visible smiley faces. Thus, the x-axis is not terribly different from the quality construct that typifies most customer satisfaction or loyalty research.
In contrast to the x-axis, the quadrant’s vertical axis represents a serious departure from traditional measurement. It addresses the memorability of each experiential dimension. Interestingly, memorability plays a substantive role in unaided brand and advertising recall studies but has not been researched extensively by customer satisfaction or brand researchers from a cognitive perspective. In the quadrant depicted in Figure 2, the memorability axis is anchored by weak/forgettable on the low end and strong/memorable on the high end. A simple but very difficult-to-answer question is: What makes each of the five experiential dimensions memorable?
Having information regarding both quality and memorability provides managers with greater flexibility when it comes to enhancing consumer experiences. Our research has shown quite unequivocally that the two axes yield very low (r<.2) correlations. Quite clearly, quality and memorability are not the same thing. Additional research confirmed that the five experience icons’ x-axis scores correlated strongly with the overall XP icon’s x-axis score but not its y-axis score. The reverse also holds true. This provides compelling evidence that the five experiential icons and the overall XP icon are not simply placed at random by respondents. Parenthetically, although additional research demonstrated that the quadrant drag-and-drop task was rated no more difficult than a Likert scale, we did exclude from analysis the 10 percent of respondents who rated the task as very difficult.
Deeper dive
The dataset driving this article has significant depth and breadth. The reader may recall that the foundational research included five sectors: banking, automotive, quick-service restaurants, shampoo and laptop computers. Each sector subsumed five brands and eight touchpoints. Despite the large overall sample size, many of these cells contained insufficient data for meaningful analysis. This was due largely to the presence of some low-incidence touchpoints (e.g., receiving a free sample of shampoo). Accordingly, a deeper dive into one sector will prove instructive and demonstrate the versatility of these data.
The shampoo sector subsumed eight touchpoints and five brands with the largest U.S. market shares: Clairol, Head & Shoulders, L’Oreal, Pantene and Suave. Four touchpoints are indirect: TV advertising; print advertising; Internet advertising; recommendations from a friend. Four are direct: purchase at a store; use at home; handling the package; free sample.
It has been selected for further analysis to demonstrate that despite its seemingly innocuous nature the shampoo experience, as defined by the eight direct and indirect XPs, yields interesting and intuitively appealing patterns that can guide managerial action.
In part one of this article all five sectors were contrasted with respect to their impression and memorability profiles. The current deeper investigation looks much more closely at the distributions associated with the shampoo sector and the five brands and eight XPs that defined it. Figure 3 summarizes the data aggregated across all eight XPs. Ten frequency distributions are depicted and all are based on a sample size of n = 2,047.
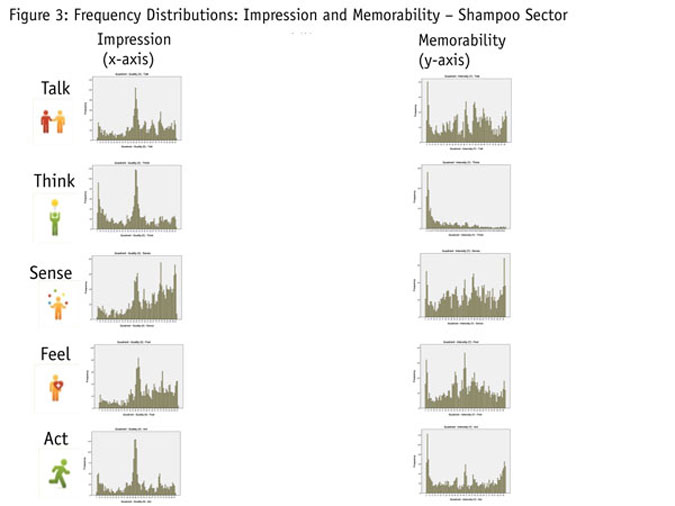
Clearly, the distributions shown in Figure 3 vary depending on the experience dimension and the axis (memorability versus impression). Let’s review the distributions across each of the five experience dimensions. First, the Talk (social) dimension yielded a quasi-normal distribution on the impression axis and a multimodal distribution with respect to memorability. Again, these data are presented at the aggregate level (across all five brands and eight XPs) so it is difficult to ascertain the source of these spikes. The shampoo experience quite clearly was not memorable from a cognitive perspective and actually elicited some negative impressions on the x-axis.
As one would expect, the shampoo XPs included in this project were driven primarily by the Sense and Feel experience dimensions. Although this may be an artifact of selecting the top five U.S. brands (in terms of market share), it remains an intuitively palatable finding. Finally, the Act dimension emerged with a nearly normal distribution in terms of impression and was deemed more forgettable than not by most respondents.
Even seasoned marketing researchers have difficulty re-integrating these two axes into a single x-y plot. To illustrate the unique and flexible nature of these data, our visualization science department created the tile mosaic plot presented in Figure 4. This representation of the data aggregates all five brands and eight XPs. The interactive version of this graphic allows the user to change experience point colors and select data based on a drop-down menu system. This gives users the ability to assess differences by gender, brand, XP, or other relevant data. In the case of Figure 4, the upper-right corner is particularly noteworthy since it represents vivid, positive valence – clearly a desirable location. The tile mosaic graph in Figure 4 is distinctive because of the density of yellow (Sense) and green (Feel) tiles in the upper-right corner. It is quite differentiated in terms of color distributions from other sectors such as automotive, computer or banking.
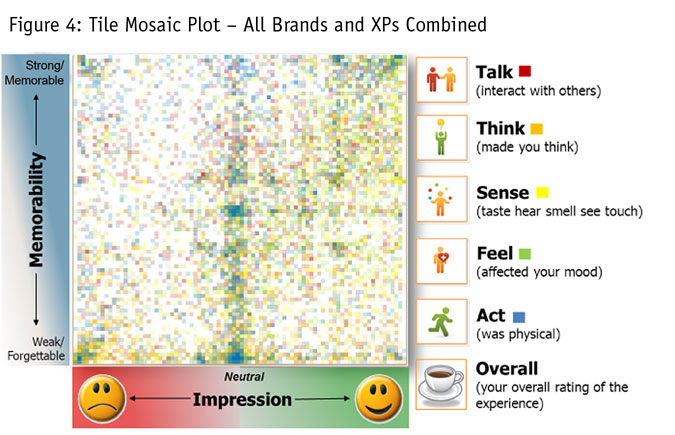
Depending upon the category and brand one would not necessarily want to have all five experience dimensions rated highly on memorability and impression. This might completely overwhelm the consumer! In the case of shampoo, the cognitive, social and perhaps behavioral experiential dimensions are of less importance than the sensorial and emotional aspects. One could argue that for a luxury shampoo brand, the most desirable strategic position would be to have as many XPs as possible characterized as positive and memorable in terms of the Sense and Feel experience dimensions.
Figure 5 presents a quadrant containing 200 points: the five brands each with eight XPs and five experiential dimensions (Talk, Think, Sense, Feel and Act). Each point represents the average score on the two dimensions. (This is noteworthy because a review of the distributions presented in Figure 3 reveals that in many cases the distributions are far from normal and the mean may be somewhat misleading.) Color is used to highlight the brands and shape illustrates the five experience dimensions. In the interest of clarity, the eight XPs are not further differentiated. As a result, each symbol-color combination is repeated eight times (once for each XP).
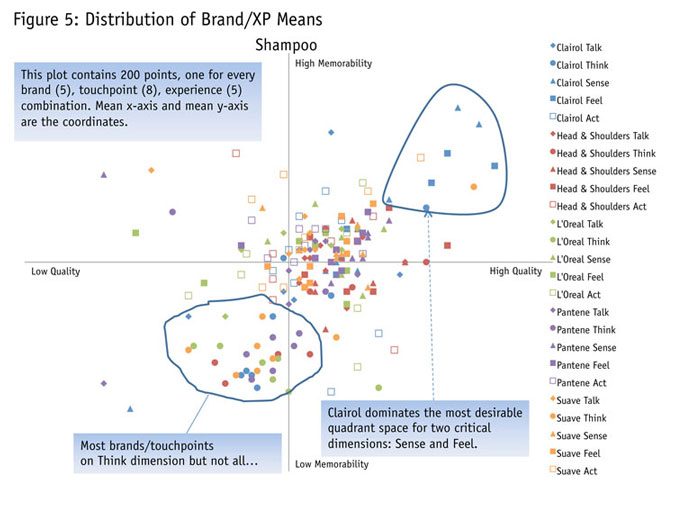
There are two aspects Figure 5 that merit discussion. First, the lower-left quadrant is characterized by an abundance of Think (•) symbols. The implication of this is that respondents overwhelmingly moved the Think icon to the lower-left corner of the quadrant regardless of XP (e.g., TV ad, free sample, etc.). While there are some exceptions to this, they are associated with small sample sizes and anomalous.
As noted earlier, given the nature of this particular sector one might argue that the Sense (^) and Feel () dimensions would ideally appear in the upper-right corner. That is, a brand with positive valence and high memorability associated with the sensorial and emotional dimensions would be in an attractive position. Thus, the second noteworthy aspect of Figure 5 involves the brands that dominate the upper-right corner with respect to Sense and Feel.
Clearly, Clairol’s Herbal Essences shampoo dominates the upper-right quadrant. The reader may recall that this brand has long been associated with television advertising containing oblique sexual innuendo. The highly sensorial Herbal Essences shampoo experience is playfully depicted in television advertising as nearly erotic. Every sector (and perhaps every brand) is likely associated with a somewhat different ideal configuration of the Talk, Think, Sense, Feel and Act icons. For example, the Herbal Essences profile would not necessarily be ideal for a computer or automobile (although it would be an interesting approach to differentiation!).
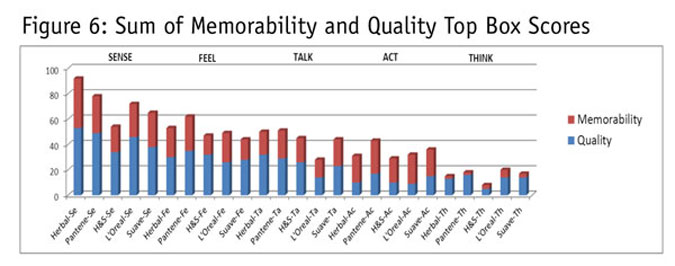
Figure 6 presents another visualization of the shampoo brands aggregated across experience touchpoints. In this case, x- and y-axis coordinates greater than 75 on the 85-point “scales” were counted as top-box and percentages calculated and summed by brand within the five experience dimensions. In nearly every case, there were more top box impression ratings than memorability ratings. In one case (Herbal Essences – Talk) memorability exceeded quality. The highest memorability ratings were associated with Herbal Essences though Pantene was close behind. A return to Figure 5 reveals that Pantene enjoyed a fair number of Sense and Feel (average) ratings in the upper-right of the quadrant.
Interestingly, we can take the sum of the five top box experience scores for each brand and describe this metric as a 5-D score. As shown in Table 1, this simple number (the sum of all icons placed above the 75 mark on both quadrant axes) aligns quite closely with 2010 unit volume estimates for each brand. Indeed, the correlation between the two is relatively strong (r = .85).
Table 1: Total Experiential Impact (5-D) and Market Share
5-D Market
Brand Score Share
Pantene 252 15%
Clairol Herbal Essences 241 9%
Suave 206 7%
L’Oreal 201 4%
Head & Shoulders 183 6%
This research precipitated numerous data visualization innovations including tile mosaic graphs in which the original quadrant space hosts an animated and interactive display of color-coded tiles corresponding to the five experience dimensions. The two-dimension quadrant space facilitates a wide range of graphic representations of data.
Figure 7 depicts the results of eight regression equations – one for every XP. Each column represents a separate regression analysis that combines data from all five brands. The four direct and four indirect XPs (columns) are separated for illustration purposes. The rows in Figure 7 reflect the 10 predictor variables: a quality and memorability metric for each of the five experience icons that respondents moved into the quadrant space. The dependent measure was the product of the overall XP icon x- and y-axes.
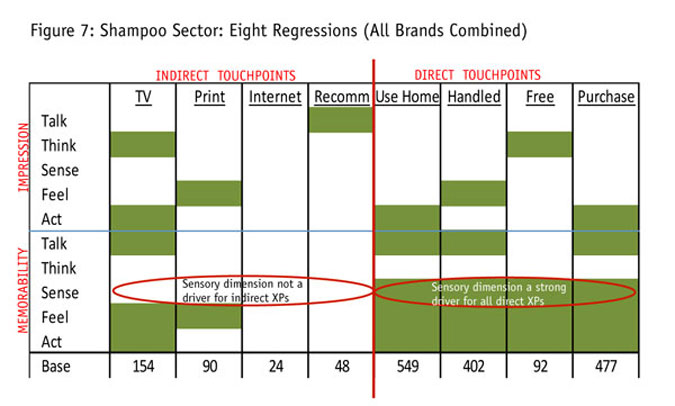
Within the table cells that are highlighted in green were statistically-significant drivers of the dependent measure (the product of the overall XP icon’s x- and y-axes). Parenthetically, note that this is not the ideal dependent measure because it makes mathematically equivalent a negative memorable experience and a positive forgettable experience. Though more difficult to convey, other approaches such as canonical correlation or SEM (both of which accommodate multiple DVs) are to be preferred.
Perhaps of greatest interest is that Sense memorability was a significant driver for all four of the direct XPs but this was not the case with respect to the indirect XPs like TV advertising. In this case, it seems clear that physical interaction with the product is necessary to generate sensorial memorability. Another noteworthy aspect of the data presented in Figure 7 involves the role of the social (Talk) dimension. It is a significant driver for only one of the eight XPs: recommended by a friend.
It should come as no surprise that the distributions shown earlier in Figure 3 do not yield particularly efficacious OLS regression models. For this reason we employ proprietary Bayesian techniques that yield R2 statistics ranging from 0.40 to 0.70. Spatial statistics offers another robust approach to treating dependence in what is essentially a Cartesian coordinate system.
Extremely rich
This article could accommodate only a limited amount of information; the dataset described here is extremely rich, spanning five industry sectors each with five brands and eight XPs. Accordingly, only a glimpse into the depth of these data was possible. Future treatments of other sectors and additional enhancements to the system may be the basis for an additional Quirk’s article.
We feel a number of innovations here will revolutionize how consumer experience measurement is conducted. The five-dimension experiential lens provides a new strategic framework for service and quality improvement efforts as well as brand-touchpoint researchers. Our quadrant drag-and-drop interface has proven to yield data that appear more intuitively palatable with respect to correlational and factorial structures.
Measurement using both impression (valence) and memorability further strengthens the system’s power. In the present shampoo example, the free-sample quality and impression were generally rated as poor and forgettable. How might a manager remedy this situation? First, from a quality perspective it is possible that an insufficient amount of shampoo was being provided in the sample or, alternatively, the package was defective and potentially leaking. Enhancing memorability, on the other hand, may entail a more attention-getting delivery method. This added flexibility gives managers more control of the XP and its impact on consumer behavior.
An important aspect of this system that could not be described fully in this article involves our standardized qualitative architecture for explicating the relationship between (in)direct XPs and the five experience dimensions. Clearly, in order to facilitate managerial action, the five experience dimensions (Talk, Think, Sense, Feel and Act) must be translated into highly operational language. This is an extremely critical feature of our system and unfortunately a full explication of the technique is beyond the scope of this article.
GfK’s consumer experience measurement system does not displace traditional customer loyalty research. One may reasonably argue that service and product quality research imposes the client organization’s structure on consumers. In contrast, the consumer experience model insists that the experience be considered within a five-dimensional framework that better represents how the human mind processes its surroundings.
References
Pine, B. and Gilmore, J. (1998). “Welcome to the Experience Economy.” Harvard Business Review. July-August: pp. 97-105.
Pinker, S. (1997). How the Mind Works. New York: Norton.
Plotkin, H. (1998). Evolution in Mind – An Introduction To Evolutionary Psychology. Cambridge, Mass.: Harvard University Press.